Free Top 5 U.S. Telecommunications Revenue by Segment (2015-2025) Chart
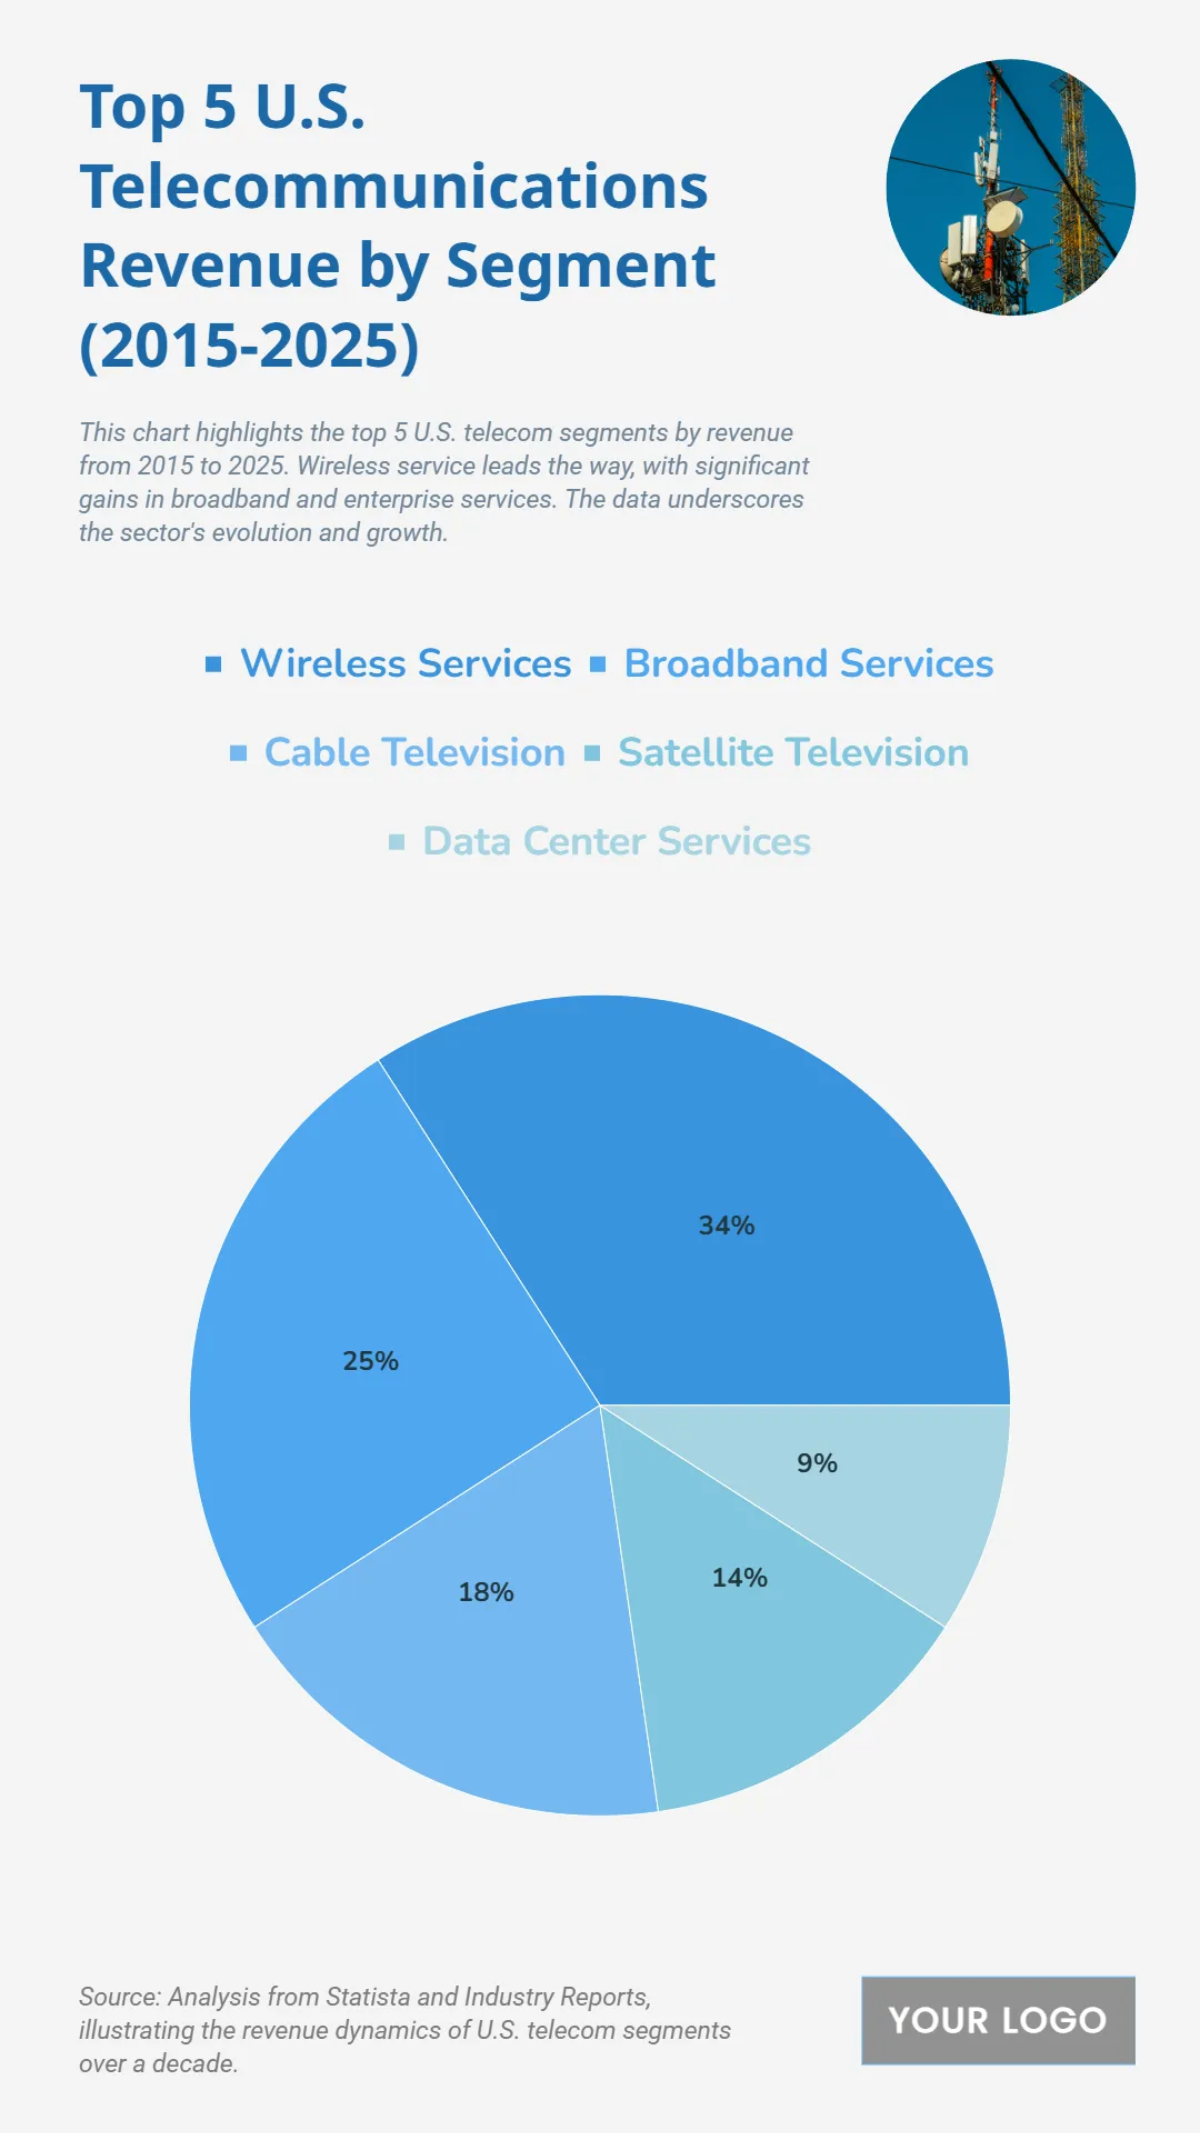
The chart provides an overview of US telecommunications revenue by segment from 2015 to 2025, revealing the dominant role of wireless and broadband services. Wireless services account for the largest share of revenue at 34%, followed by broadband services which represent 23% of the total. Data center services are the next largest contributor at 18%, reflecting the growing importance of data infrastructure. In contrast, traditional services like cable television and satellite television account for 14% and 9% respectively. This data illustrates a significant shift away from traditional broadcast models towards a more mobile and data-centric telecommunications landscape.
| Labels | Revenue (in billions) |
|---|---|
| Wireless Services | 150 |
| Broadband Services | 110 |
| Cable Television | 80 |
| Satellite Television | 60 |
| Data Center Services | 40 |


