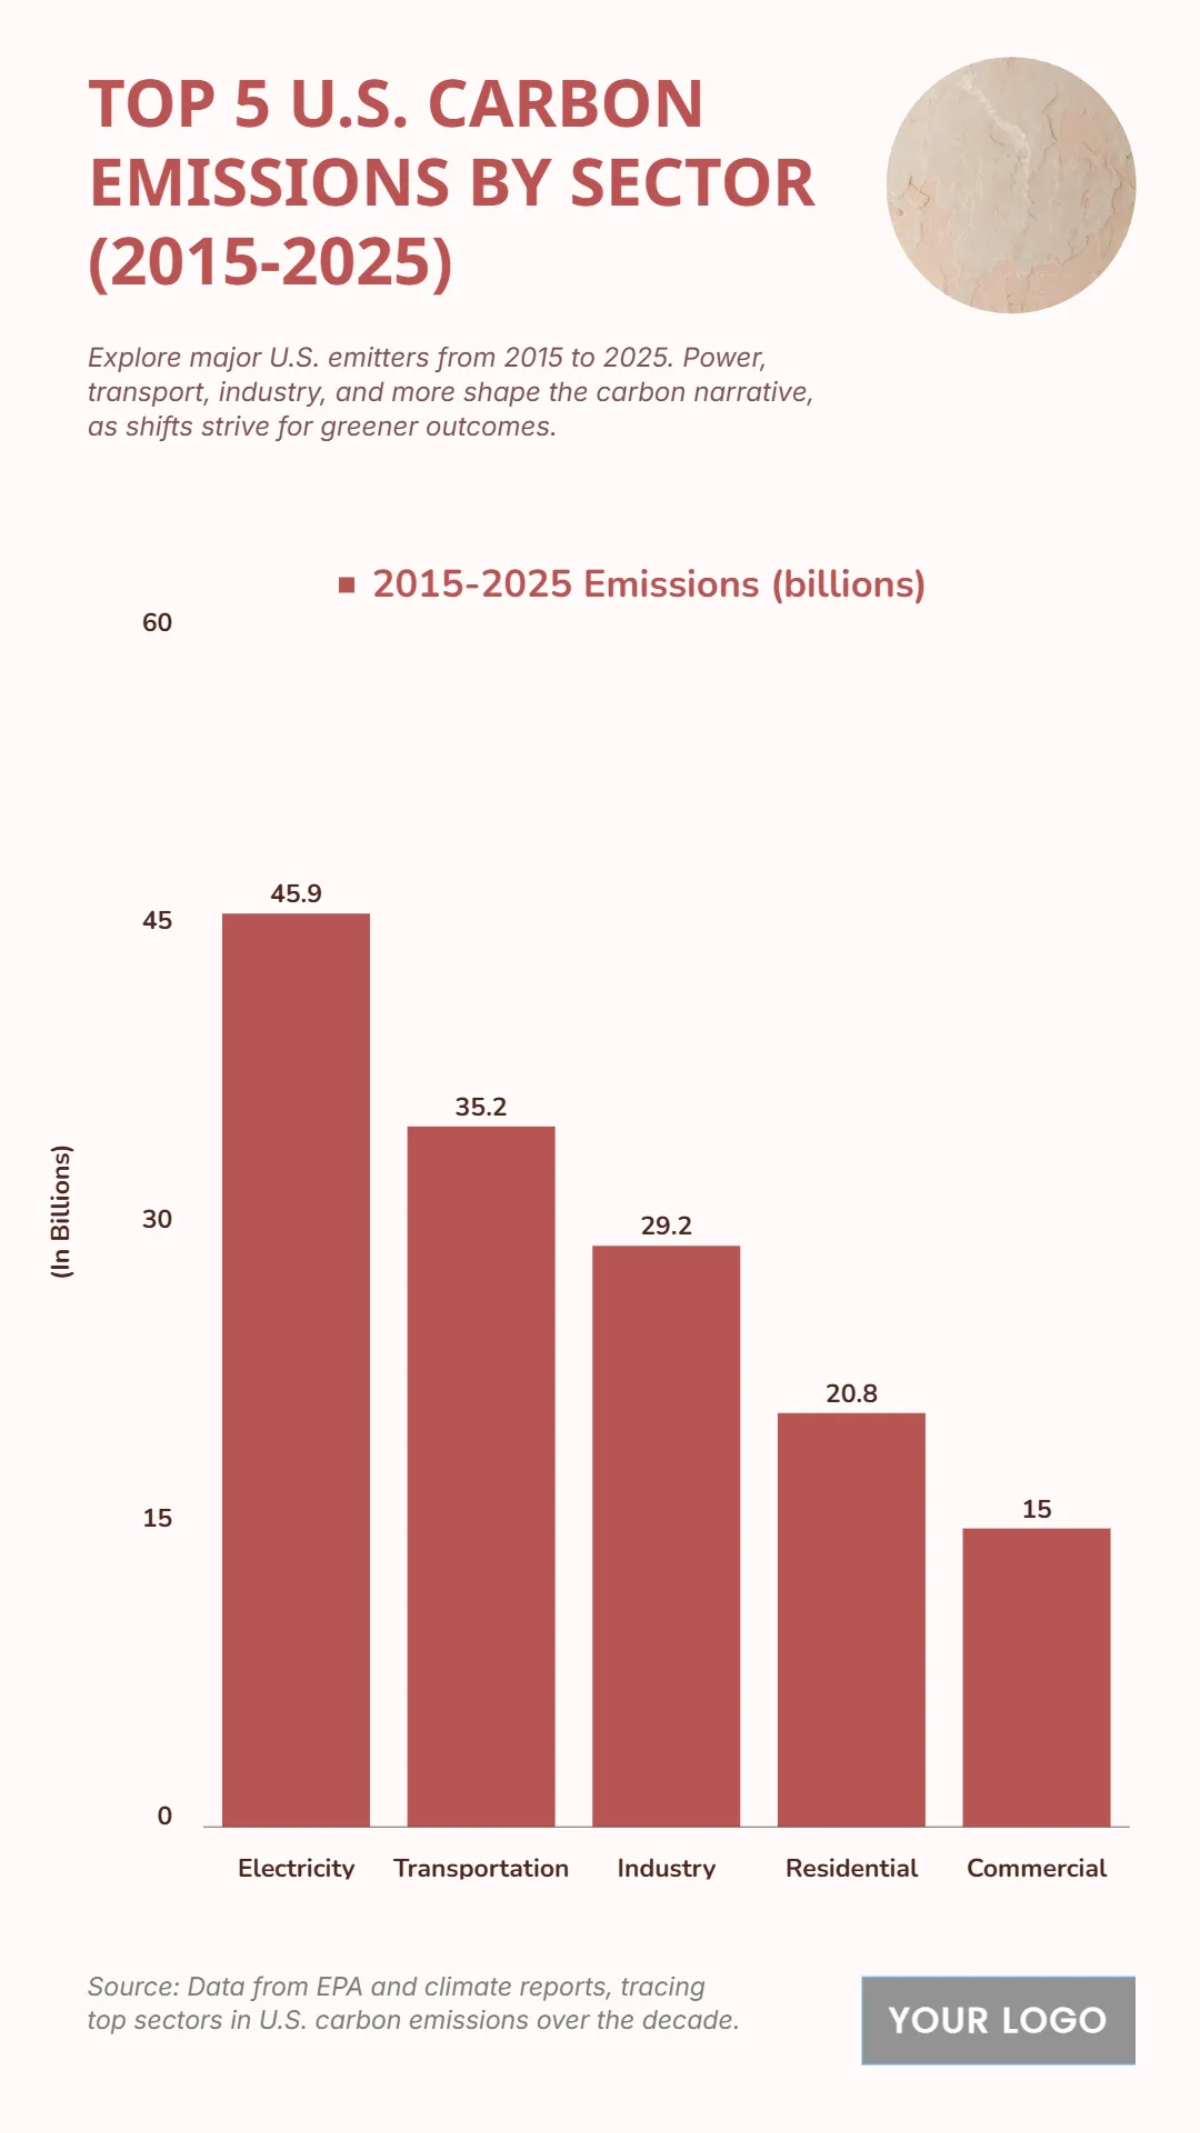
Free Top 5 U.S. Carbon Emissions by Sector (2015-2025) Chart
The chart provides a clear overview of the top 5 US carbon emissions by sector from 2015 to 2025, revealing a significant concentration of emissions in a few key industries. The Electricity sector accounts for the largest share, with a total of 43.3 billion tons of emissions. Transportation follows as the next major contributor at 33.2 billion tons, and Industry ranks third with 29.2 billion tons. The Residential and Commercial sectors contribute the least, with 20.8 billion and 13.0 billion tons, respectively. This data underscores how the nation's energy and transportation sectors are the primary drivers of carbon emissions.
| Emission Source | 2015–2025 Emissions (billions) |
|---|---|
| Electricity | 45.9 |
| Transportation | 35.2 |
| Industry | 29.2 |
| Residential | 20.8 |
| Commercial | 15 |


