Free Top 5 U.S. Trade Tariff Revenues by Product Category (2020-2025) Charts
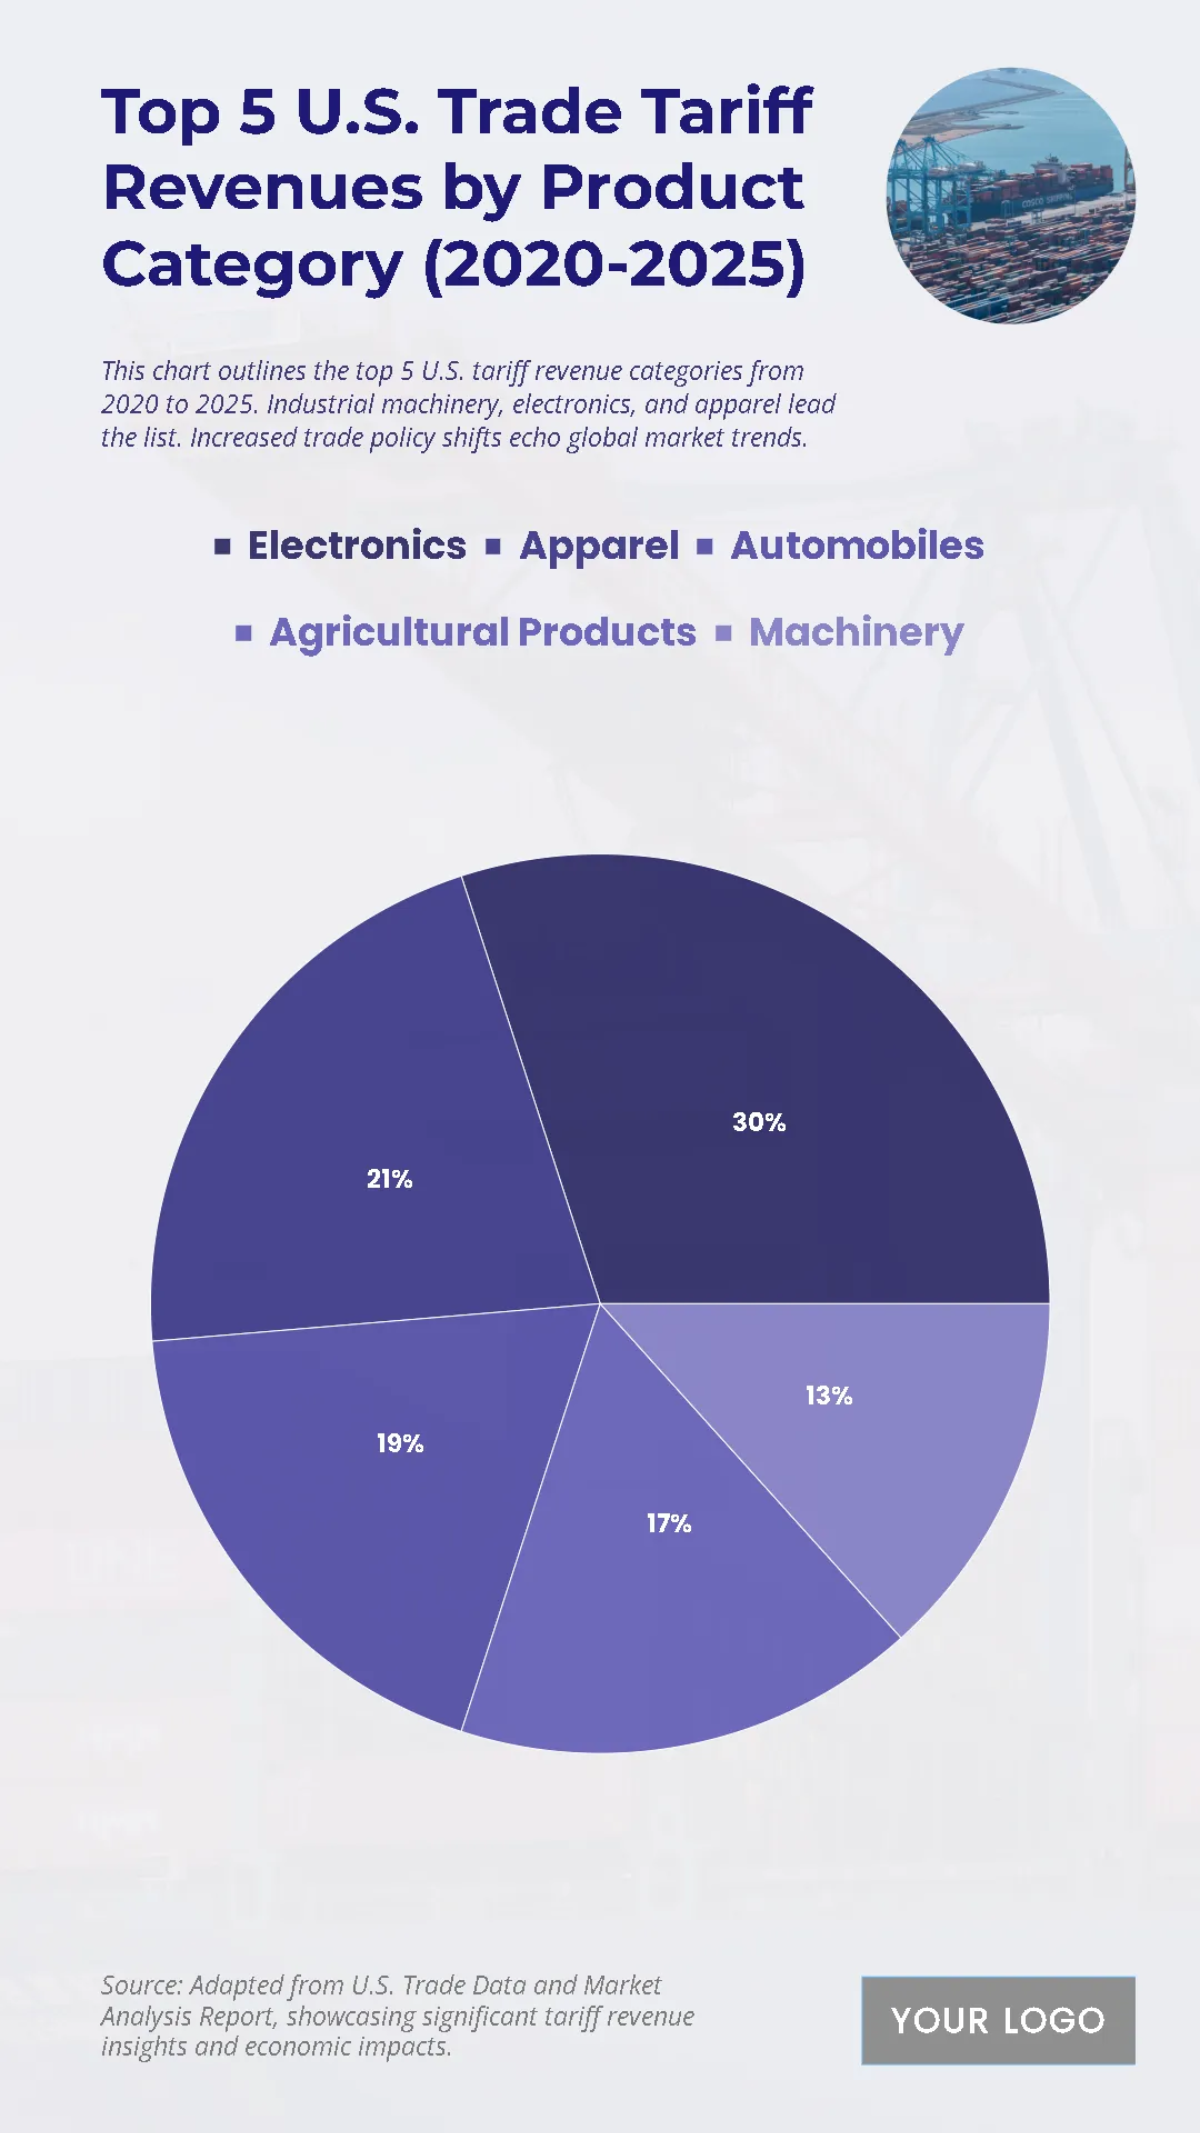
The chart provides an overview of US trade tariff revenues by product category from 2020 to 2025, revealing that a few key categories dominate. Electronics account for the largest share of tariff revenue at 30%, while machinery is the next largest contributor at 27%. These two categories alone make up over half of all tariff revenue. Automobiles and apparel also contribute a significant portion, representing 18% and 15% respectively. The remaining 10% of revenue comes from agricultural products. The data demonstrates how evolving trade policies have placed a concentrated tariff burden on high-value manufactured goods.
| Labels | Revenue in Billions |
|---|---|
| Electronics | 45 |
| Apparel | 32 |
| Automobiles | 28 |
| Agricultural Products | 25 |
| Machinery | 20 |


