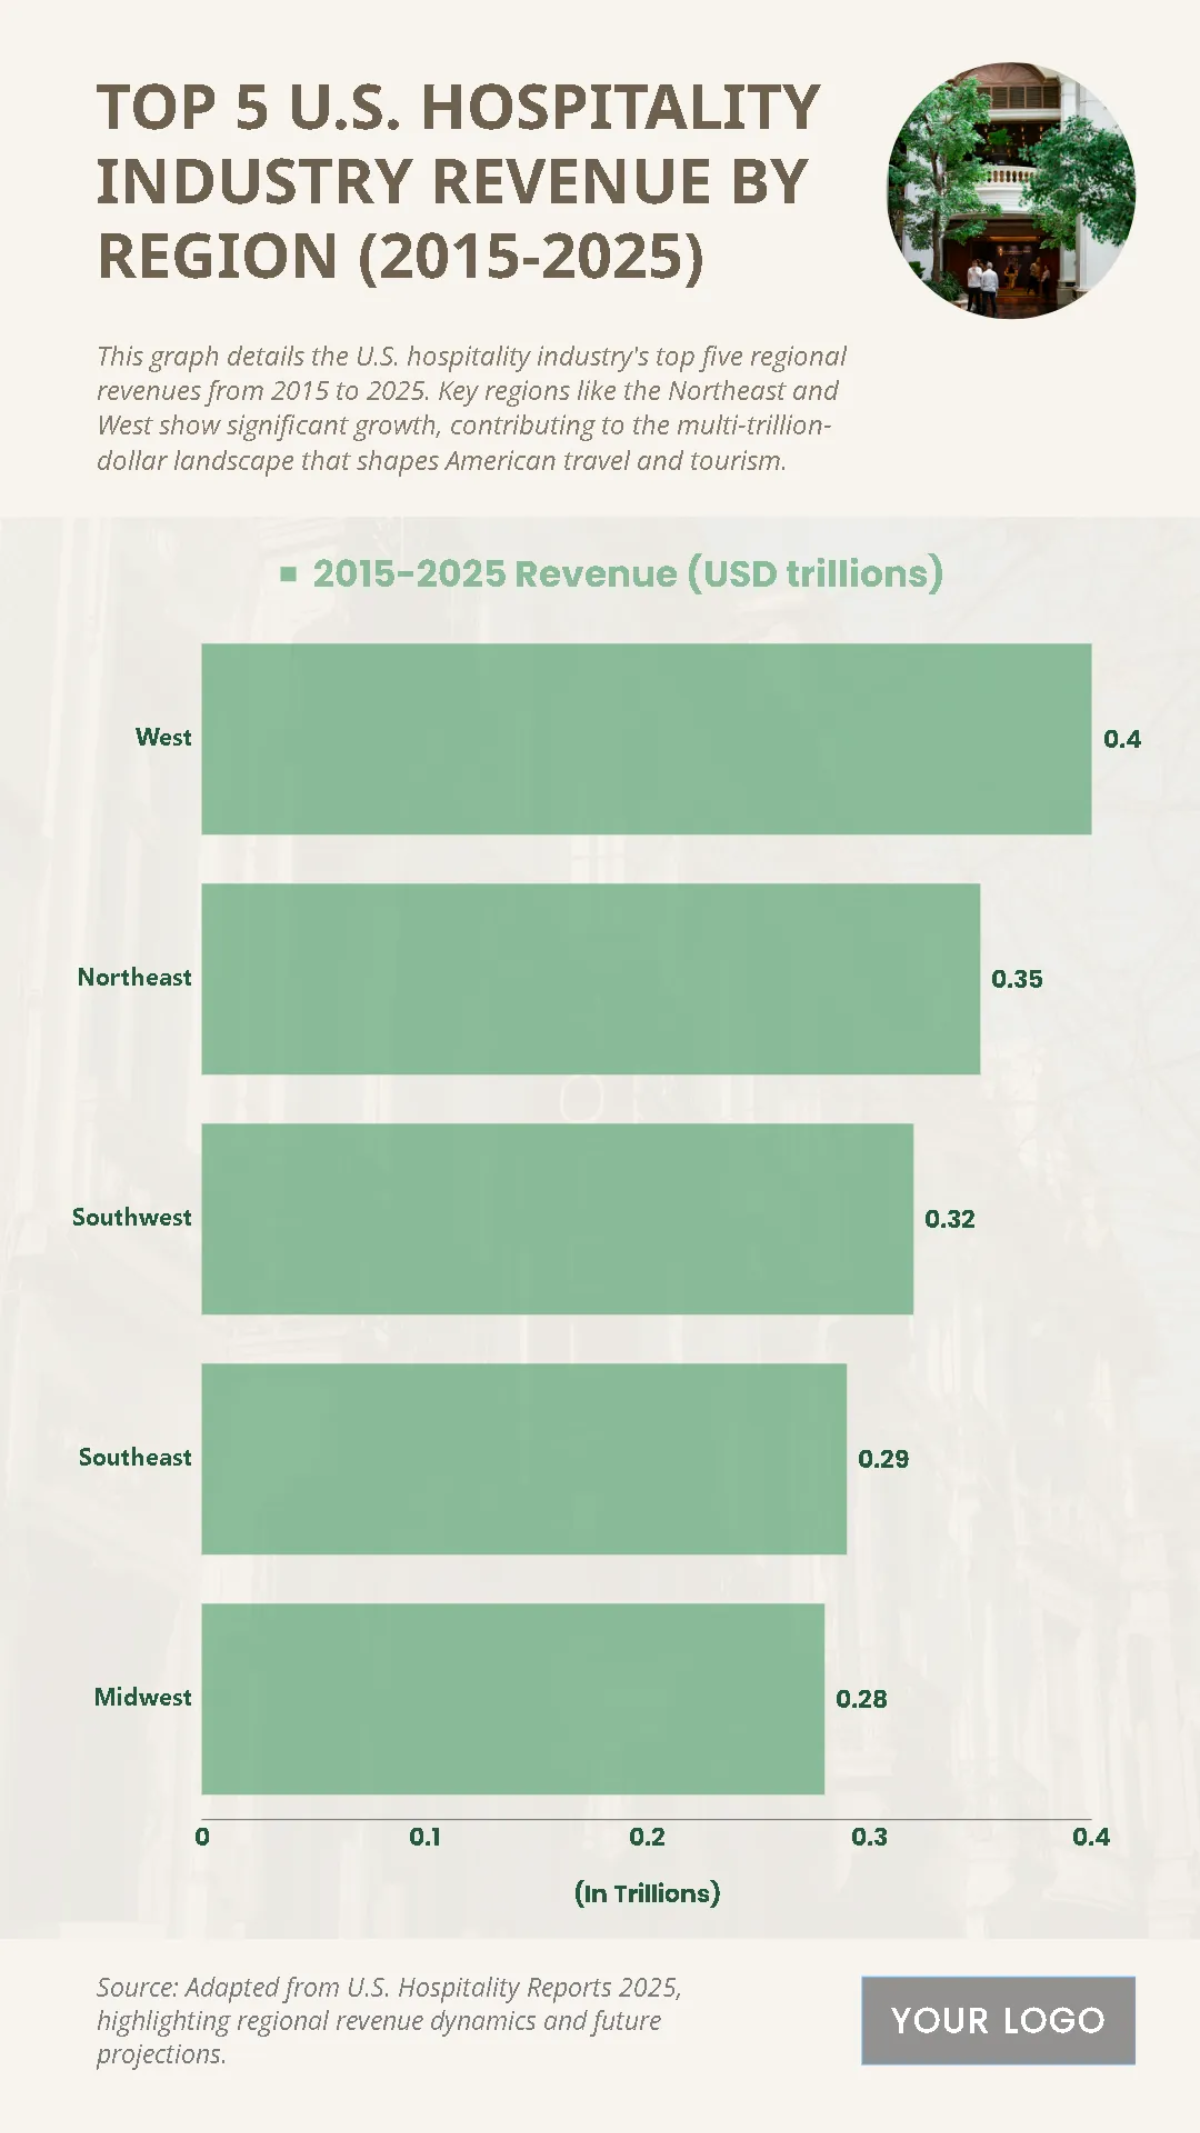
Free Top 5 U.S. Hospitality Industry Revenue by Region (2015-2025) Chart
The chart provides an overview of the top five U.S. regions by hospitality industry revenue from 2015 to 2025, revealing a significant concentration of tourism and travel spending in certain areas. The West region leads with a total revenue of $0.4 trillion, followed by the Northeast at $0.35 trillion. The Southwest and Southeast are also major contributors with $0.32 trillion and $0.29 trillion, respectively, while the Midwest rounds out the top five with $0.25 trillion. This data demonstrates how the nation’s hospitality revenue is largely concentrated in a few key regions, reflecting their popularity as travel destinations.
| Labels | 2015–2025 Revenue (USD trillions) |
|---|---|
| West | 0.4 |
| Northeast | 0.35 |
| Southwest | 0.32 |
| Southeast | 0.29 |
| Midwest | 0.28 |


