Free U.S. Consumer Electronics Spending by Age Group (2015-2025) Chart
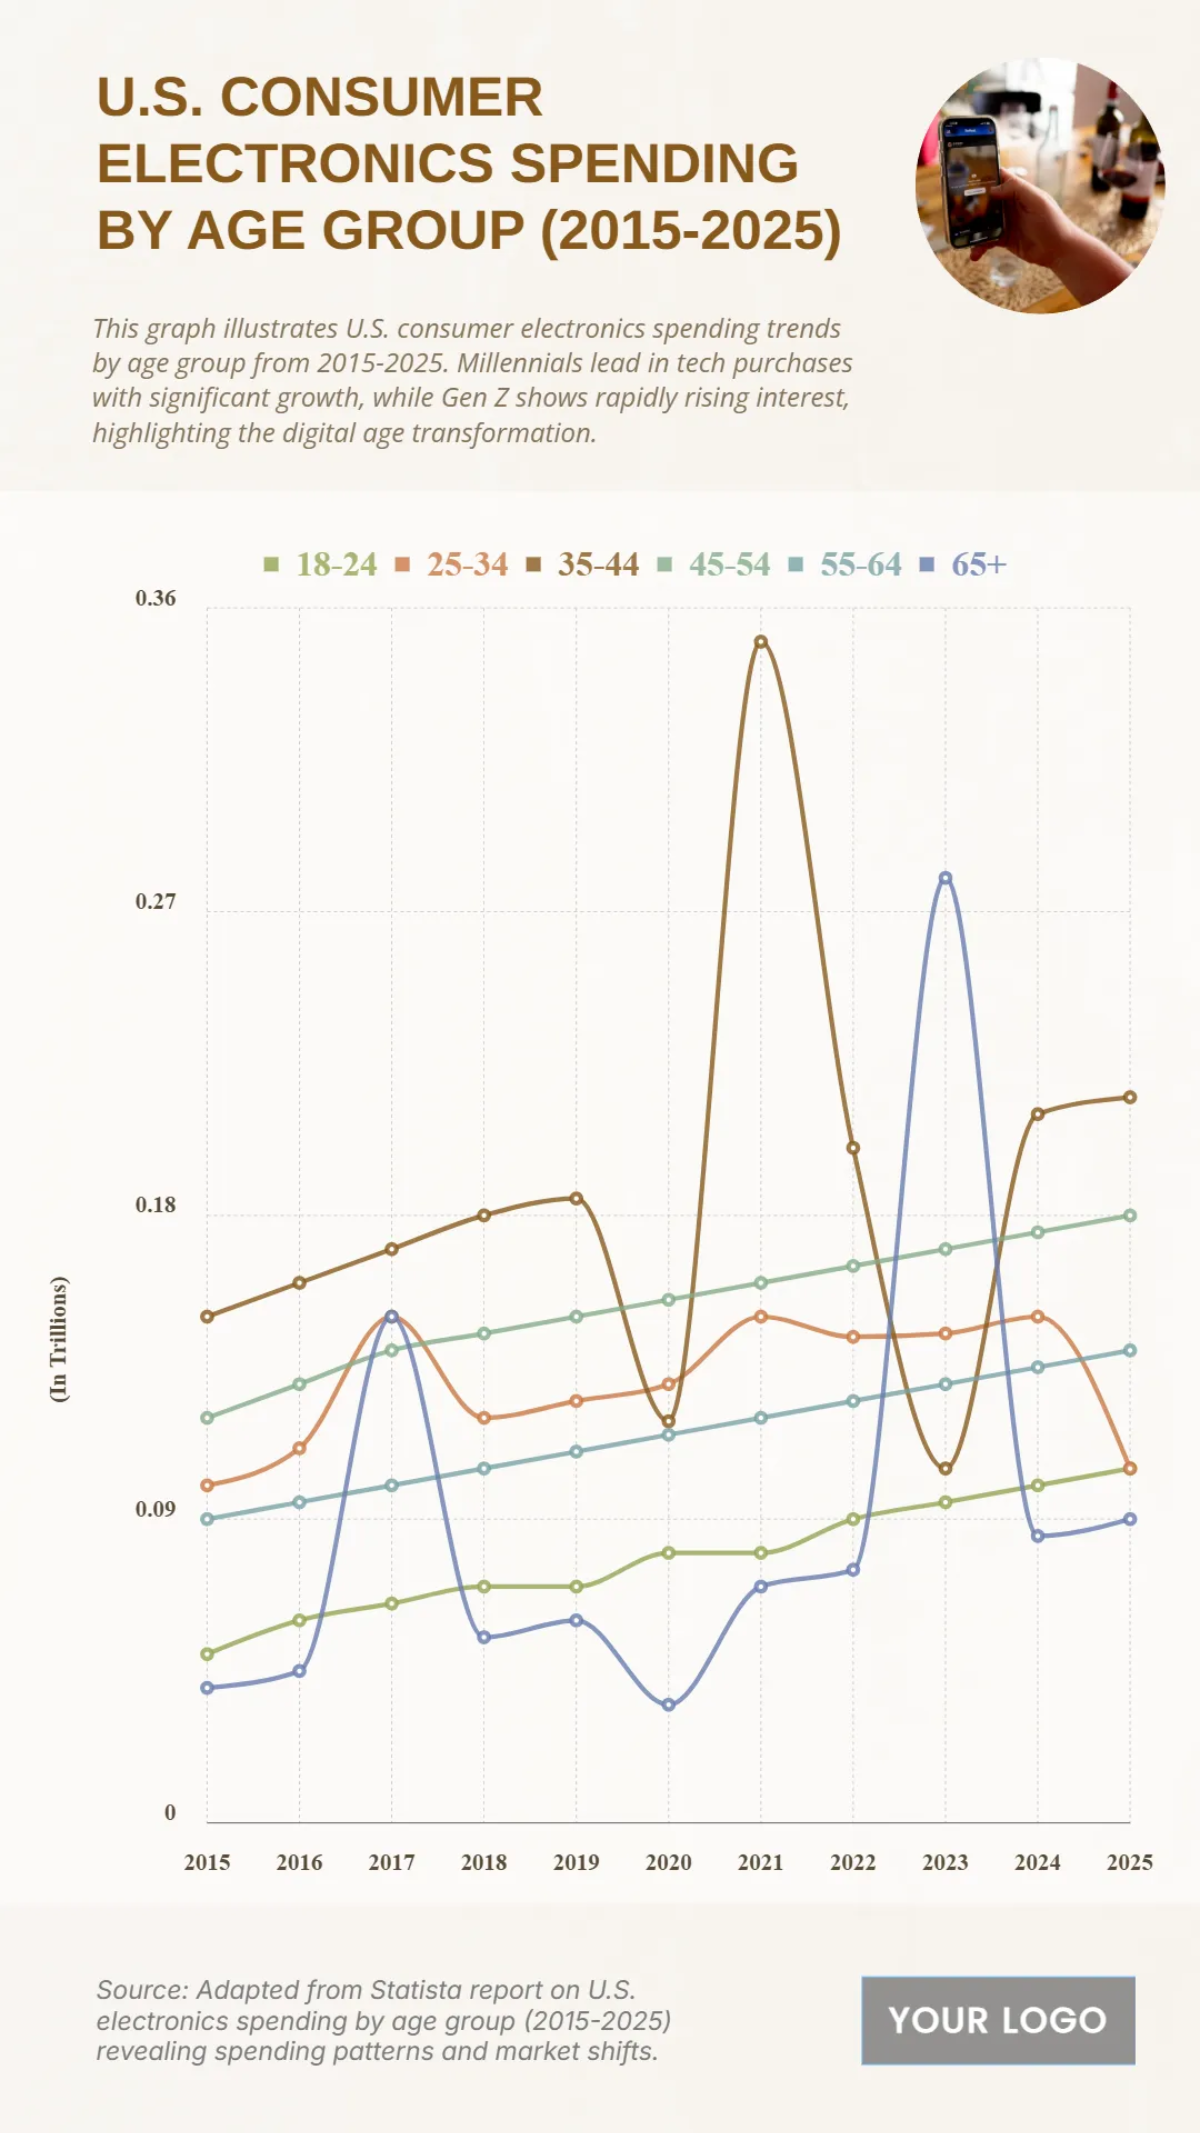
The chart provides an overview of U.S. consumer electronics spending by age group from 2015 to 2025, revealing highly volatile trends across all demographics. The 45-54 age group shows the highest spending, with a dramatic peak of nearly $0.6 trillion in 2022, followed by a steep drop. The 35-44 and 55-64 age groups also show strong, yet fluctuating, growth, with spending rising to a projected $0.5 trillion and $0.45 trillion respectively in 2025. Younger age groups like 18-24 and 25-34 show a lower but generally upward trajectory. This data highlights the significant impact of economic shifts and market trends on electronics spending across all age brackets.
| Labels | 18-24 | 25-34 | 35-44 | 45-54 | 55-64 | 65+ |
|---|---|---|---|---|---|---|
| 2015 | 0.05 | 0.1 | 0.15 | 0.12 | 0.09 | 0.04 |
| 2016 | 0.06 | 0.111 | 0.16 | 0.13 | 0.095 | 0.045 |
| 2017 | 0.065 | 0.15 | 0.17 | 0.14 | 0.1 | 0.05 |
| 2018 | 0.07 | 0.12 | 0.18 | 0.145 | 0.105 | 0.055 |
| 2019 | 0.07 | 0.125 | 0.185 | 0.15 | 0.11 | 0.06 |
| 2020 | 0.08 | 0.13 | 0.119 | 0.155 | 0.115 | 0.035 |
| 2021 | 0.08 | 0.15 | 0.35 | 0.16 | 0.12 | 0.07 |
| 2022 | 0.09 | 0.144 | 0.2 | 0.165 | 0.125 | 0.075 |
| 2023 | 0.095 | 0.145 | 0.105 | 0.17 | 0.13 | 0.28 |
| 2024 | 0.1 | 0.15 | 0.21 | 0.175 | 0.135 | 0.085 |
| 2025 | 0.105 | 0.105 | 0.215 | 0.18 | 0.14 | 0.09 |


