Free Top 5 U.S. Telehealth Services Spending by Region (2020-2025) Chart
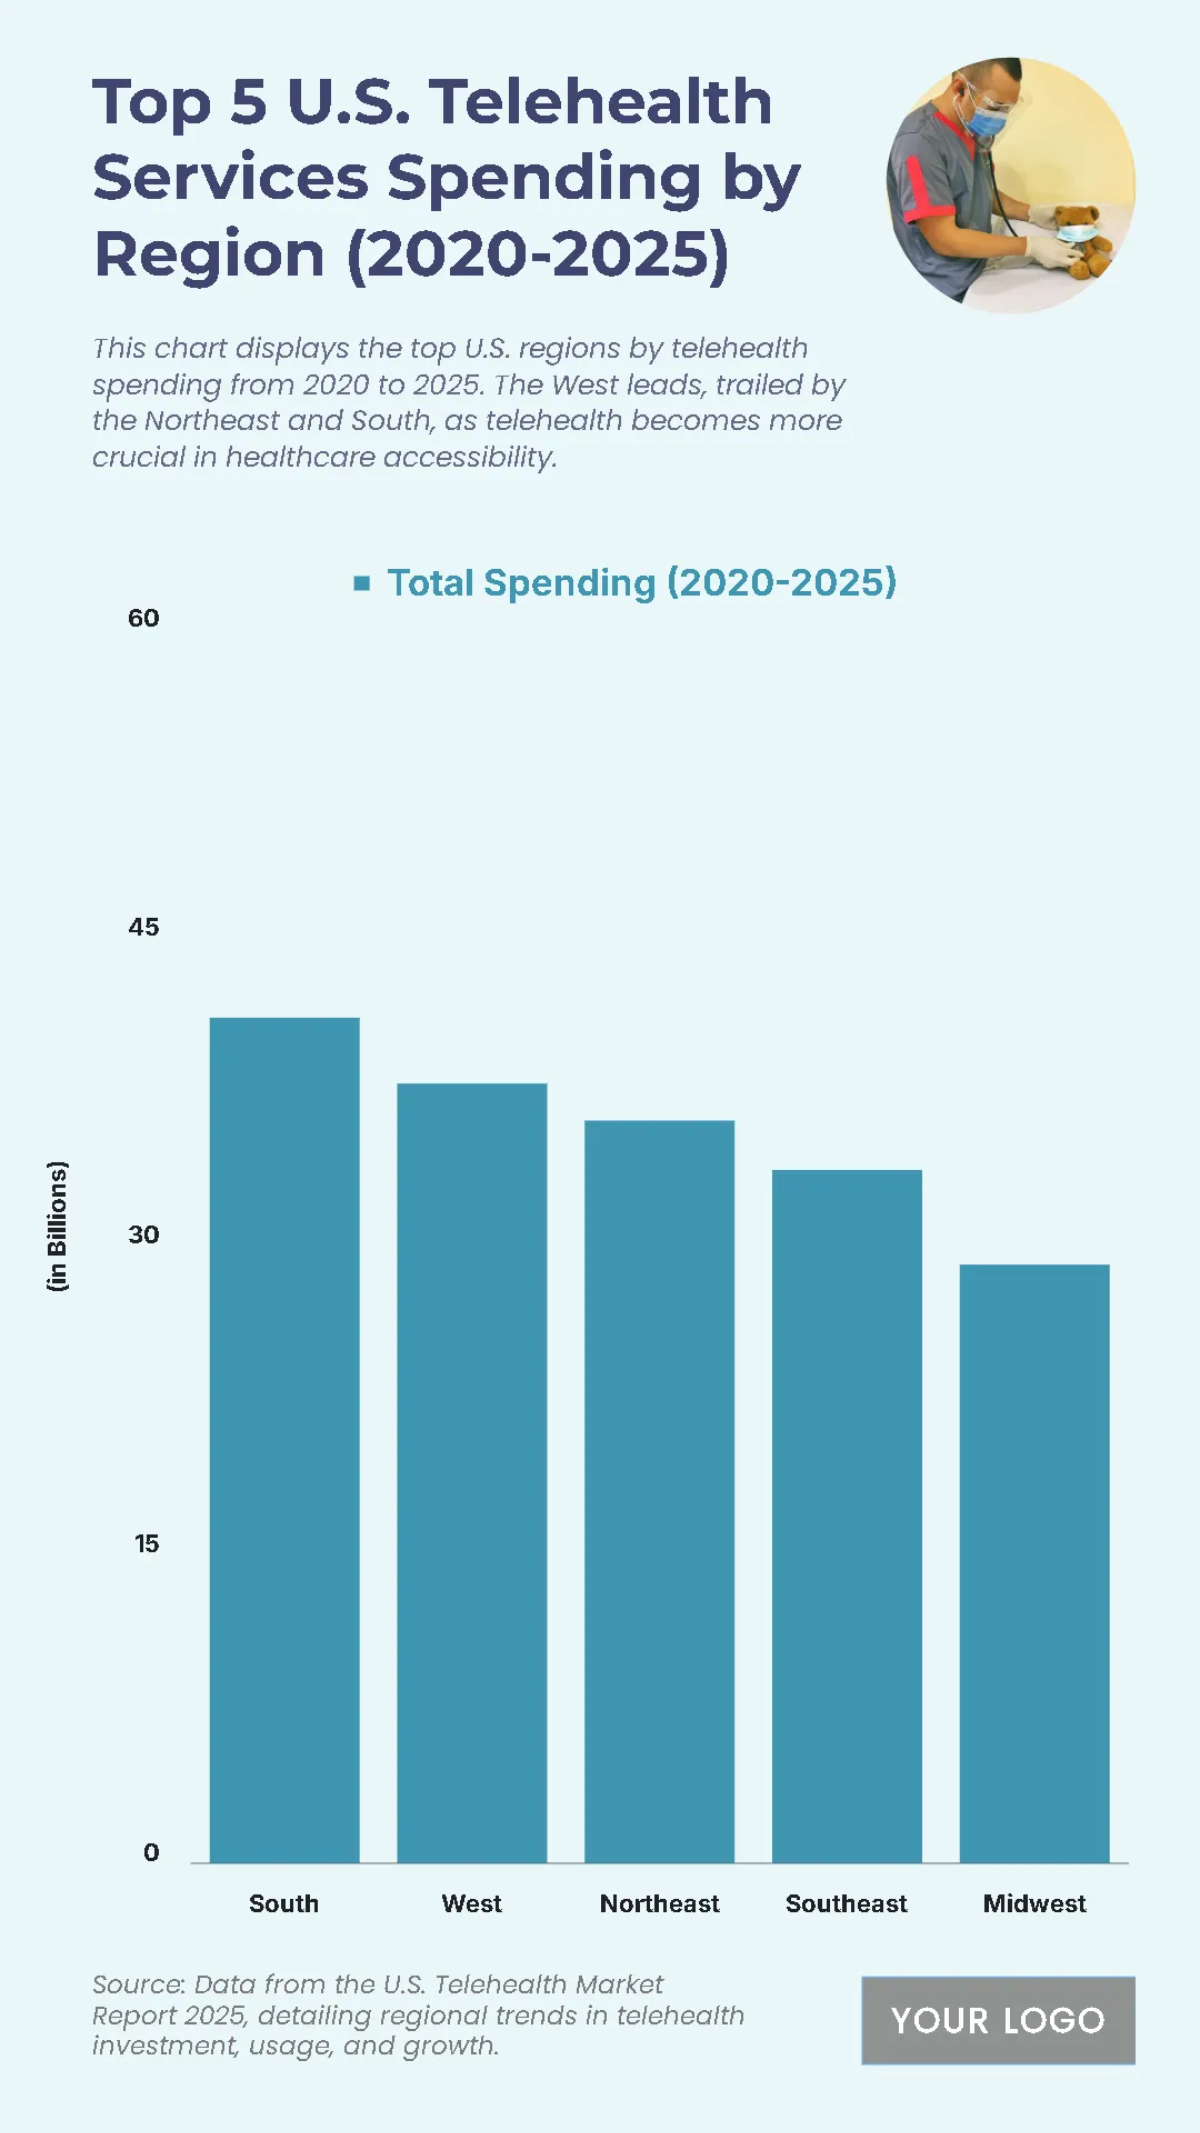
The chart provides an overview of U.S. telehealth services spending by region from 2020 to 2025, revealing a significant concentration of spending in a few key areas. The West region leads the nation with a total spending of approximately $8.5 billion, followed by the Northeast at $6.0 billion and the South at $5.5 billion. The Midwest and Pacific regions follow with spending of around $4.5 billion and $3.0 billion respectively. The data demonstrates how telehealth services are becoming increasingly crucial for healthcare accessibility, with the highest spending concentrated in the West and Northeast regions.
| Labels | Total Spending (2020–2025) |
|---|---|
| South | 41.1 |
| West | 37.9 |
| Northeast | 36.1 |
| Southeast | 33.7 |
| Midwest | 29.1 |


