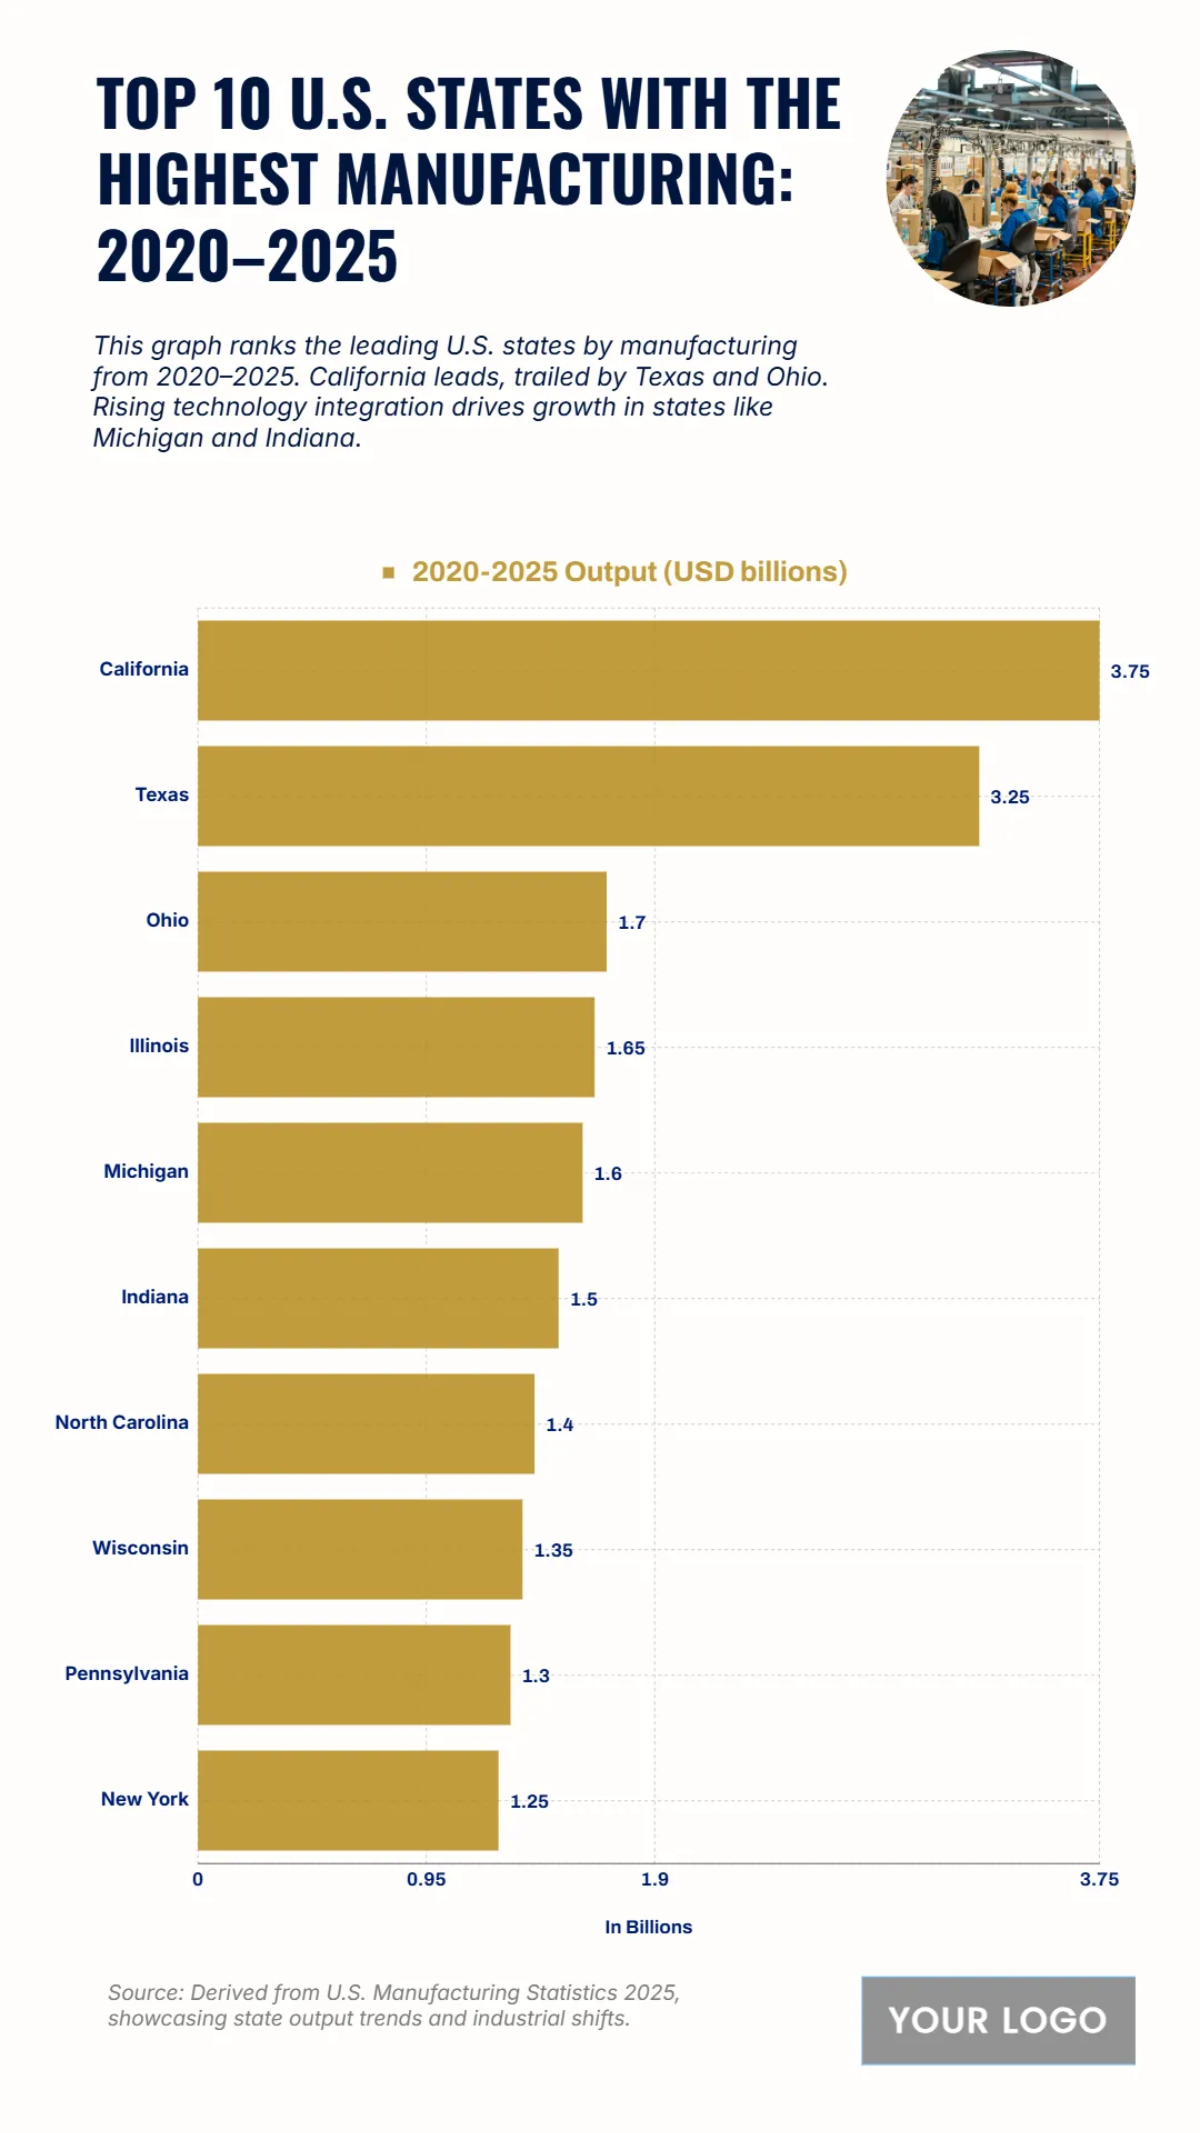
Free Top 10 U.S. States with the Highest Manufacturing Output (2020–2025) Chart
The chart provides an overview of the top 10 U.S. states with the highest manufacturing output from 2020 to 2025, revealing a clear concentration of production in a few key states. California leads the nation with an output of $3.75 billion, followed by Texas at $3.25 billion. The data shows a significant drop in output for the states that follow, with Ohio ranking third with $1.7 billion. This trend highlights how manufacturing output is highly concentrated in the nation's largest and most technologically advanced states, such as Michigan and Indiana, which also show strong growth.
| Labels | 2020–2025 Output (USD billions) |
|---|---|
| California | 3.75 |
| Texas | 3.25 |
| Ohio | 1.7 |
| Illinois | 1.65 |
| Michigan | 1.6 |
| Indiana | 1.5 |
| North Carolina | 1.4 |
| Wisconsin | 1.35 |
| Pennsylvania | 1.3 |
| New York | 1.25 |


