Free Top 20 U.S. States by Total Tax Revenue (2020–2025) Chart
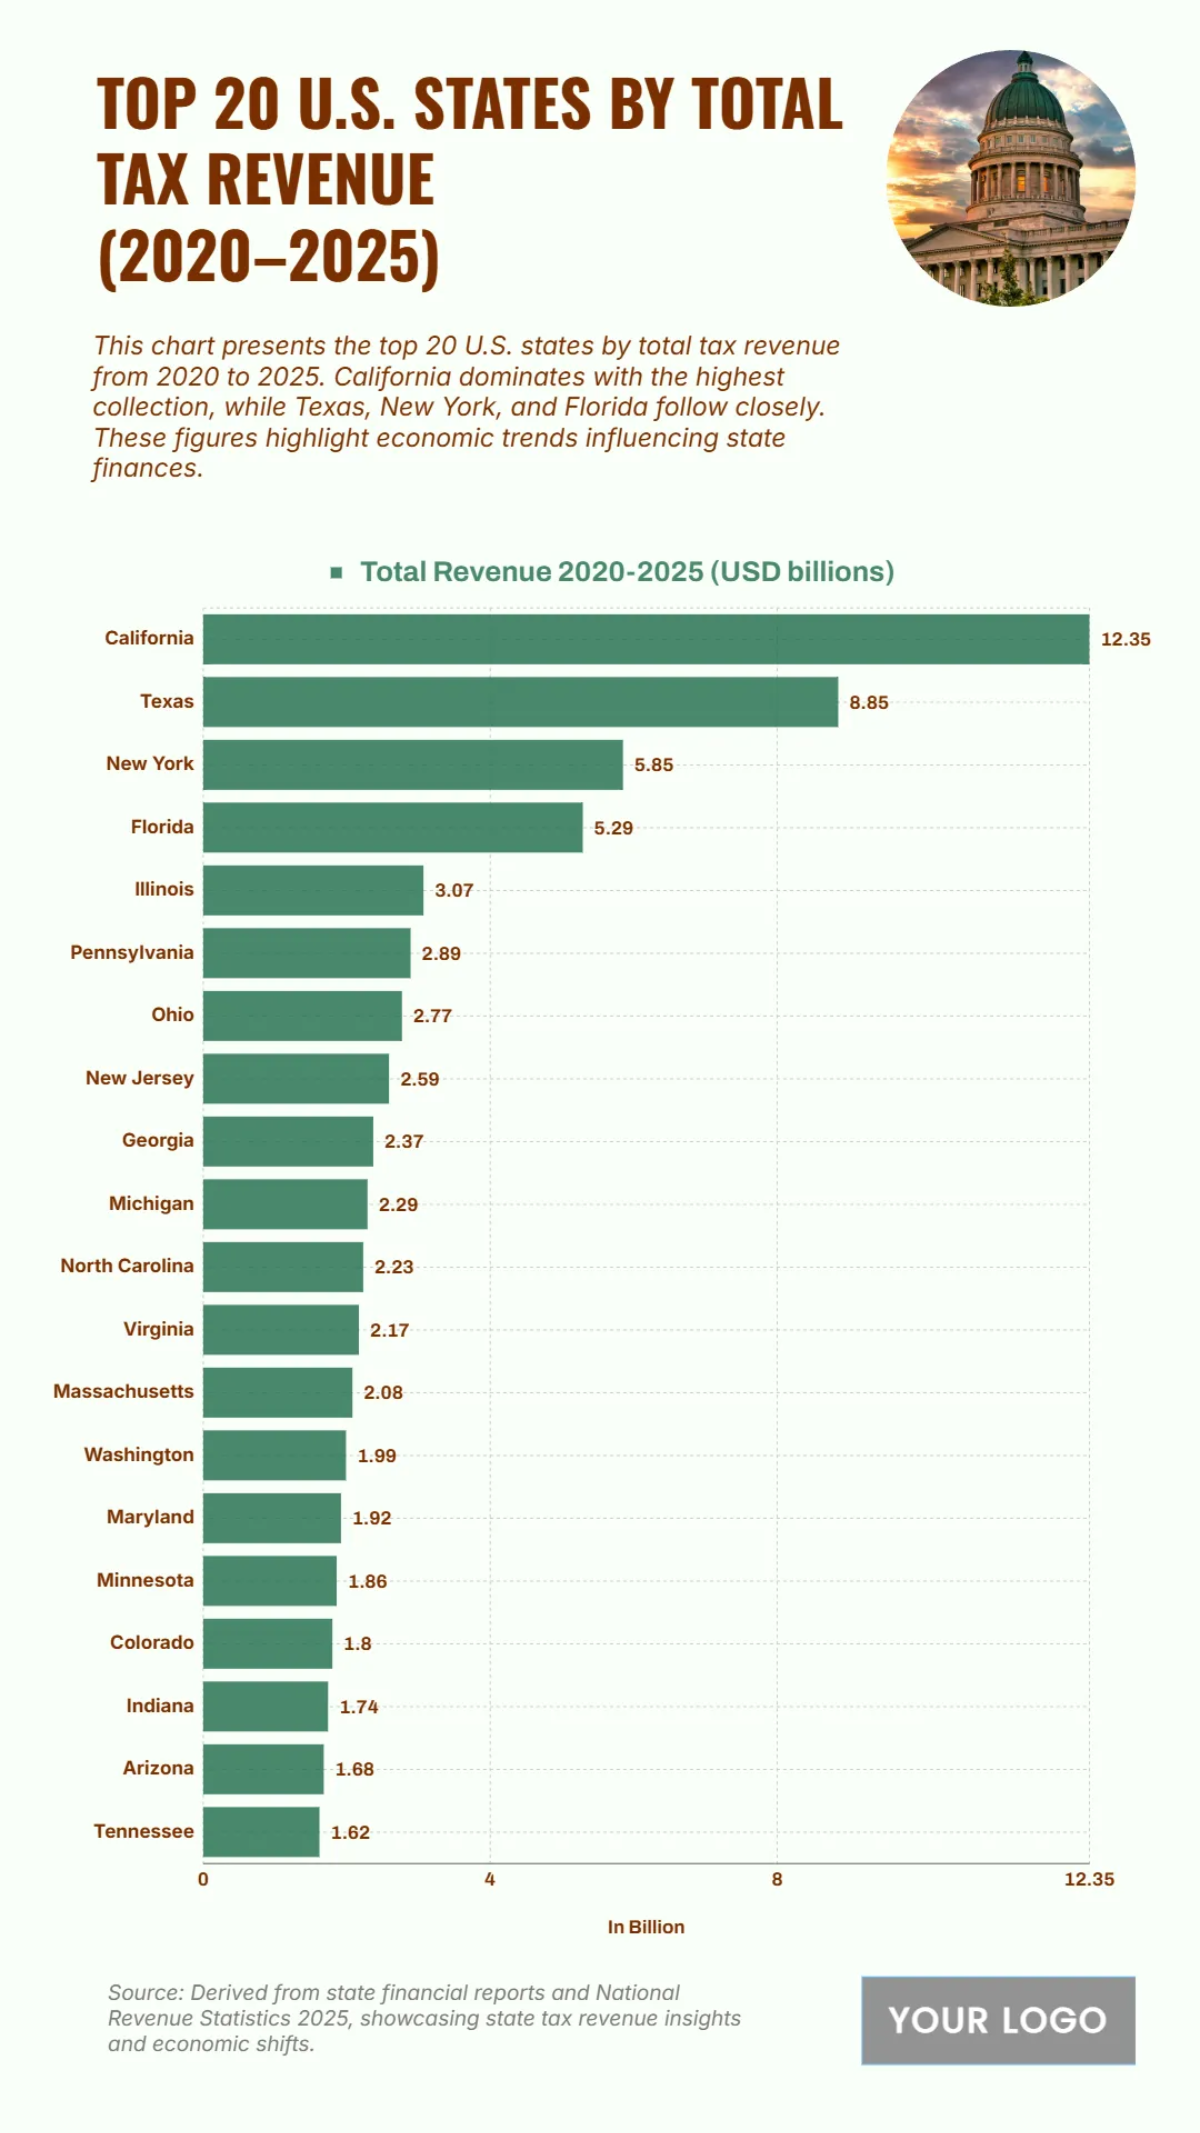
The chart illustrates the top 20 U.S. states by total tax revenue from 2020 to 2025, showcasing each state's financial contribution in USD billions. California leads by a significant margin, generating $12.35 billion, underscoring its robust economy and high tax collection rates. Texas follows with $8.85 billion, reflecting strong industrial and commercial sectors driving state revenue. New York ranks third with $5.85 billion, highlighting its substantial financial and business activities, while Florida closely follows with $5.29 billion, boosted by tourism and population growth. Illinois secures fifth place at $3.07 billion, supported by diversified industries. States like Pennsylvania ($2.89 billion) and Ohio ($2.77 billion) show consistent tax collection across multiple sectors, while New Jersey ($2.59 billion) and Georgia ($2.37 billion) indicate healthy regional economies. The lower half of the chart includes Michigan ($2.29 billion), North Carolina ($2.23 billion), Virginia ($2.17 billion), and Massachusetts ($2.08 billion), all showing steady fiscal management. States such as Washington ($1.99 billion), Maryland ($1.92 billion), Minnesota ($1.86 billion), and Colorado ($1.8 billion) also contribute notably. Rounding out the list are Indiana ($1.74 billion), Arizona ($1.68 billion), and Tennessee ($1.62 billion), emphasizing their growing but comparatively smaller tax bases within the national fiscal landscape.
| Labels | Total Revenue 2020–2025 (USD billions) |
|---|---|
| California | 12.35 |
| Texas | 8.85 |
| New York | 5.85 |
| Florida | 5.29 |
| Illinois | 3.07 |
| Pennsylvania | 2.89 |
| Ohio | 2.77 |
| New Jersey | 2.59 |
| Georgia | 2.37 |
| Michigan | 2.29 |
| North Carolina | 2.23 |
| Virginia | 2.17 |
| Massachusetts | 2.08 |
| Washington | 1.99 |
| Maryland | 1.92 |
| Minnesota | 1.86 |
| Colorado | 1.80 |
| Indiana | 1.74 |
| Arizona | 1.68 |
| Tennessee | 1.62 |


