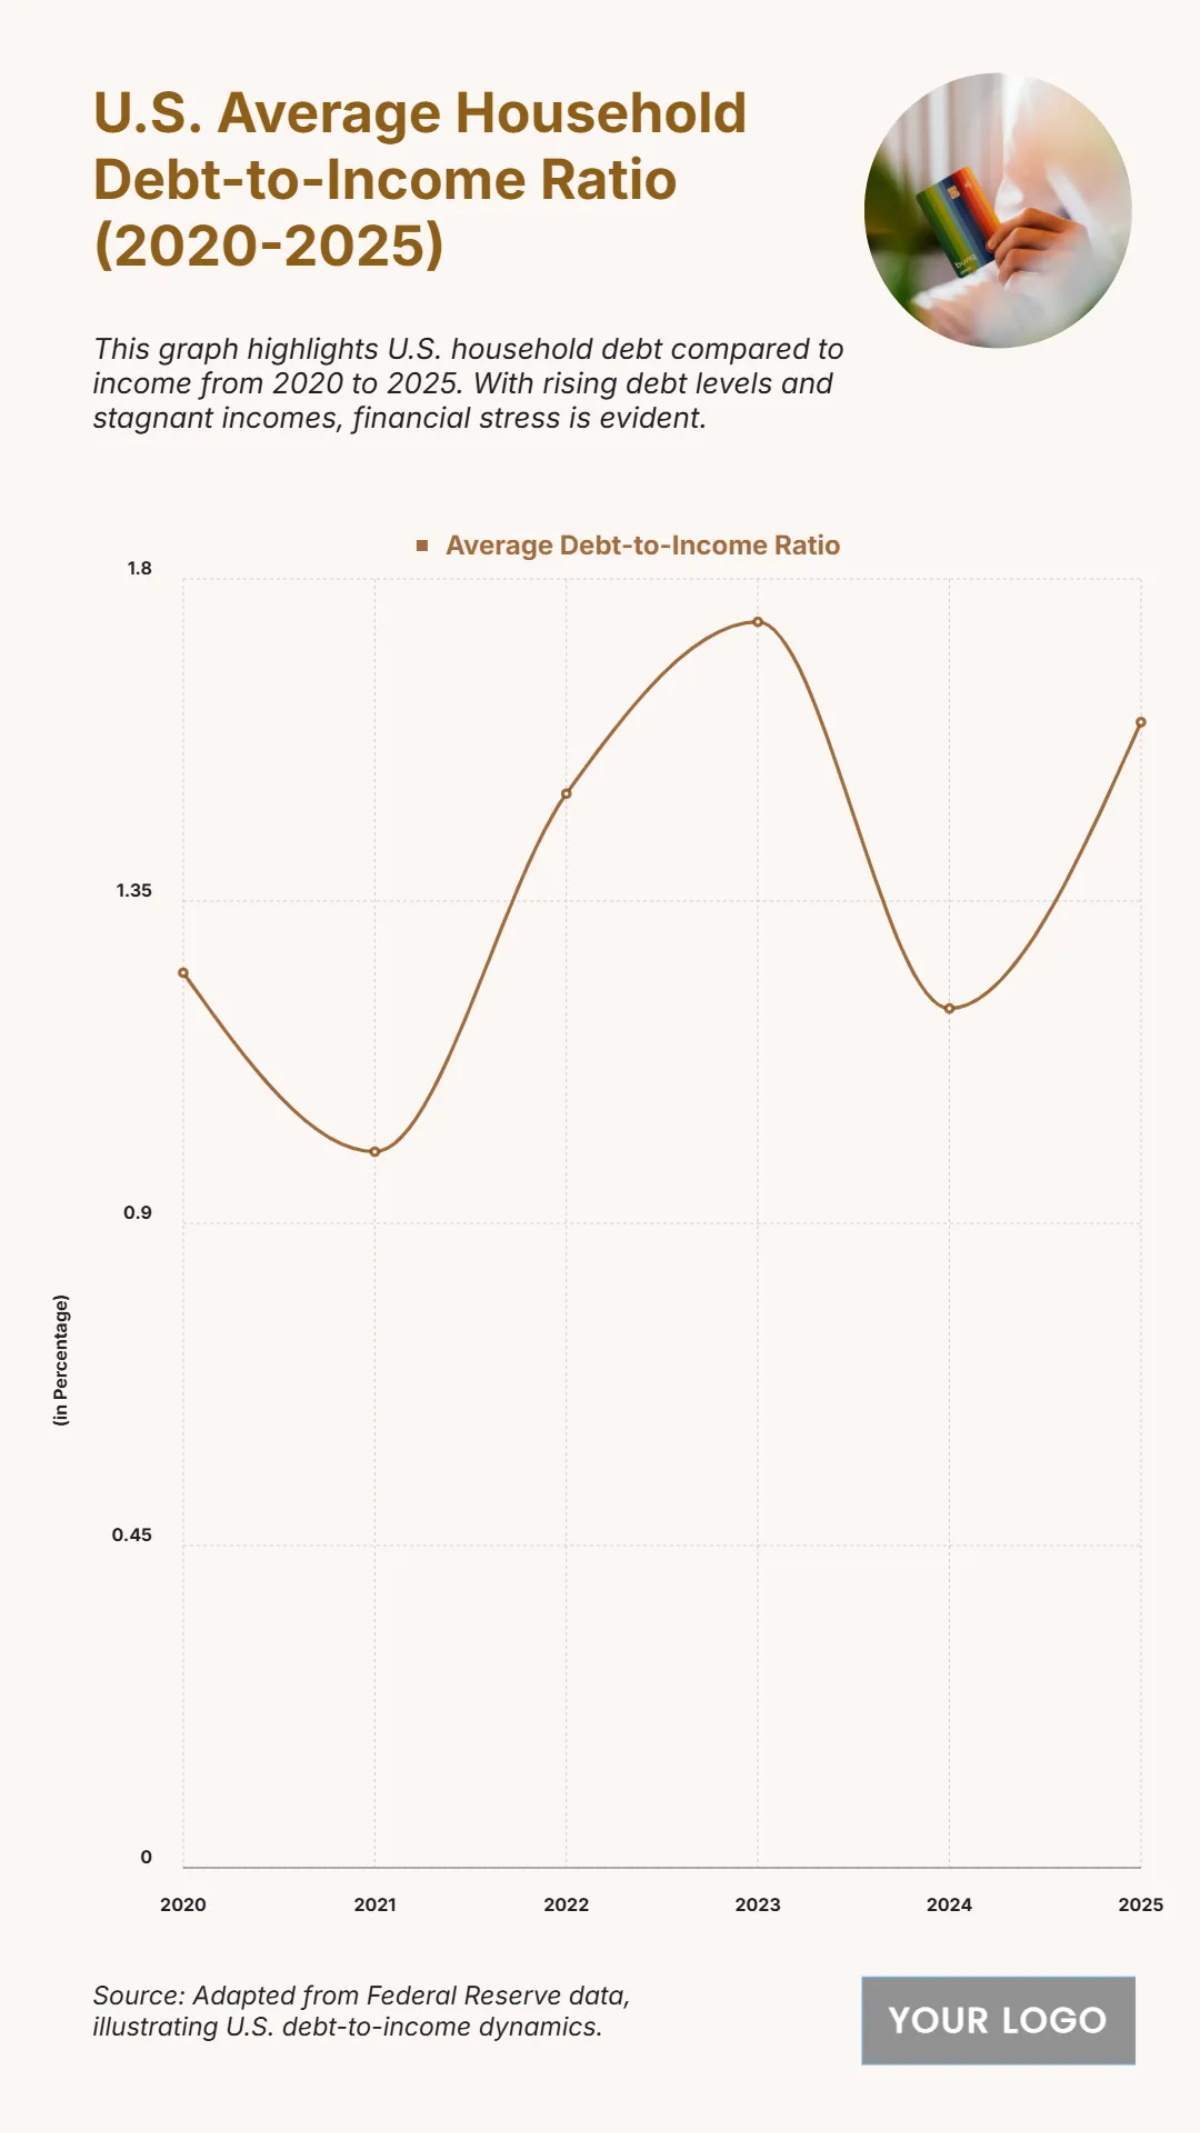
Free U.S. Average Household Debt-to-Income Ratio (2020-2025) Chart
The chart shows the U.S. average household debt-to-income ratio from 2020 to 2025, expressed as a percentage. In 2020, the ratio was about 120 percent before dropping to roughly 100 percent in 2021. By 2022, it rose sharply to around 150 percent, and in 2023 it peaked at approximately 170 percent, highlighting increased financial strain as household debt outpaced income growth. The ratio then declined to nearly 110 percent in 2024, suggesting temporary relief, before climbing again to about 150 percent in 2025. Overall, the data reflects recurring cycles of rising debt pressure compared to household income within this five-year span.
| Labels |
Average Debt-to-Income Ratio |
| 2020 | 1.25 |
| 2021 | 1 |
| 2022 | 1.5 |
| 2023 | 1.74 |
| 2024 | 1.2 |
| 2025 | 1.6 |


