Free Top 10 U.S. Cities by Commercial Rent Prices (2015-2025) Chart
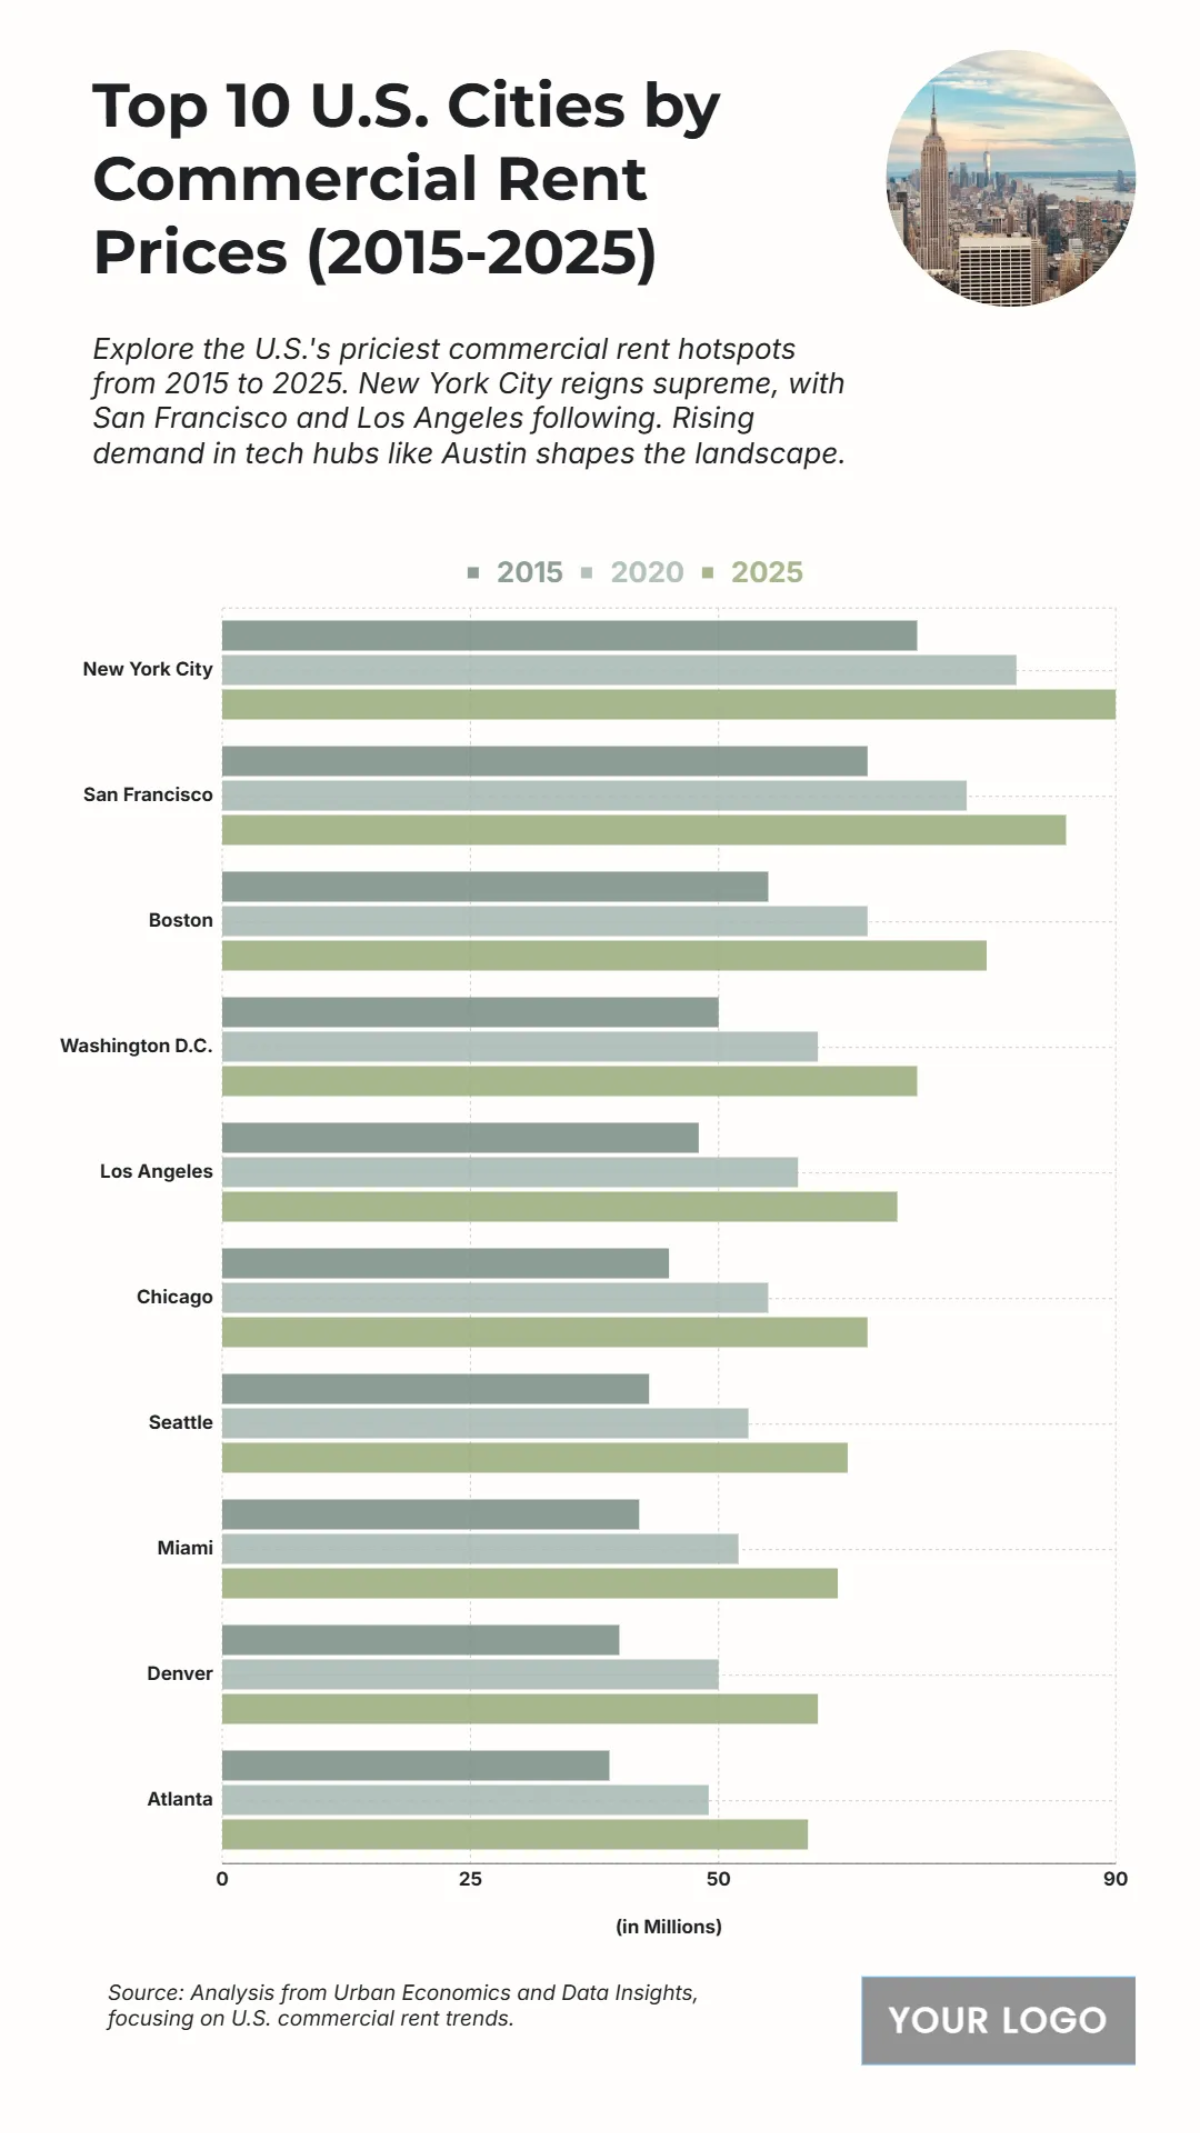
The chart highlights the top 10 U.S. cities by commercial rent prices from 2015 to 2025, measured in millions of dollars. New York City consistently leads, rising from around 70 million in 2015 to about 90 million in 2025. San Francisco follows, climbing from nearly 50 million in 2015 to over 80 million in 2025. Boston shows steady growth from around 40 million in 2015 to close to 70 million in 2025, while Washington D.C. and Los Angeles also surpass 60 million by 2025. Other cities, including Chicago, Seattle, Miami, Denver, and Atlanta, record increases ranging from 40 to 60 million, reflecting broader upward trends in commercial rental markets.
| Labels | 2015 | 2020 | 2025 |
| New York City | 70 | 80 | 90 |
| San Francisco | 65 | 75 | 85 |
| Boston | 55 | 65 | 77 |
| Washington D.C. | 50 | 60 | 70 |
| Los Angeles | 48 | 58 | 68 |
| Chicago | 45 | 55 | 65 |
| Seattle | 43 | 53 | 63 |
| Miami | 42 | 52 | 62 |
| Denver | 40 | 50 | 60 |
| Atlanta | 39 | 49 | 59 |


