Free U.S. Public Education Enrollment vs. Funding (2020-2025) Chart
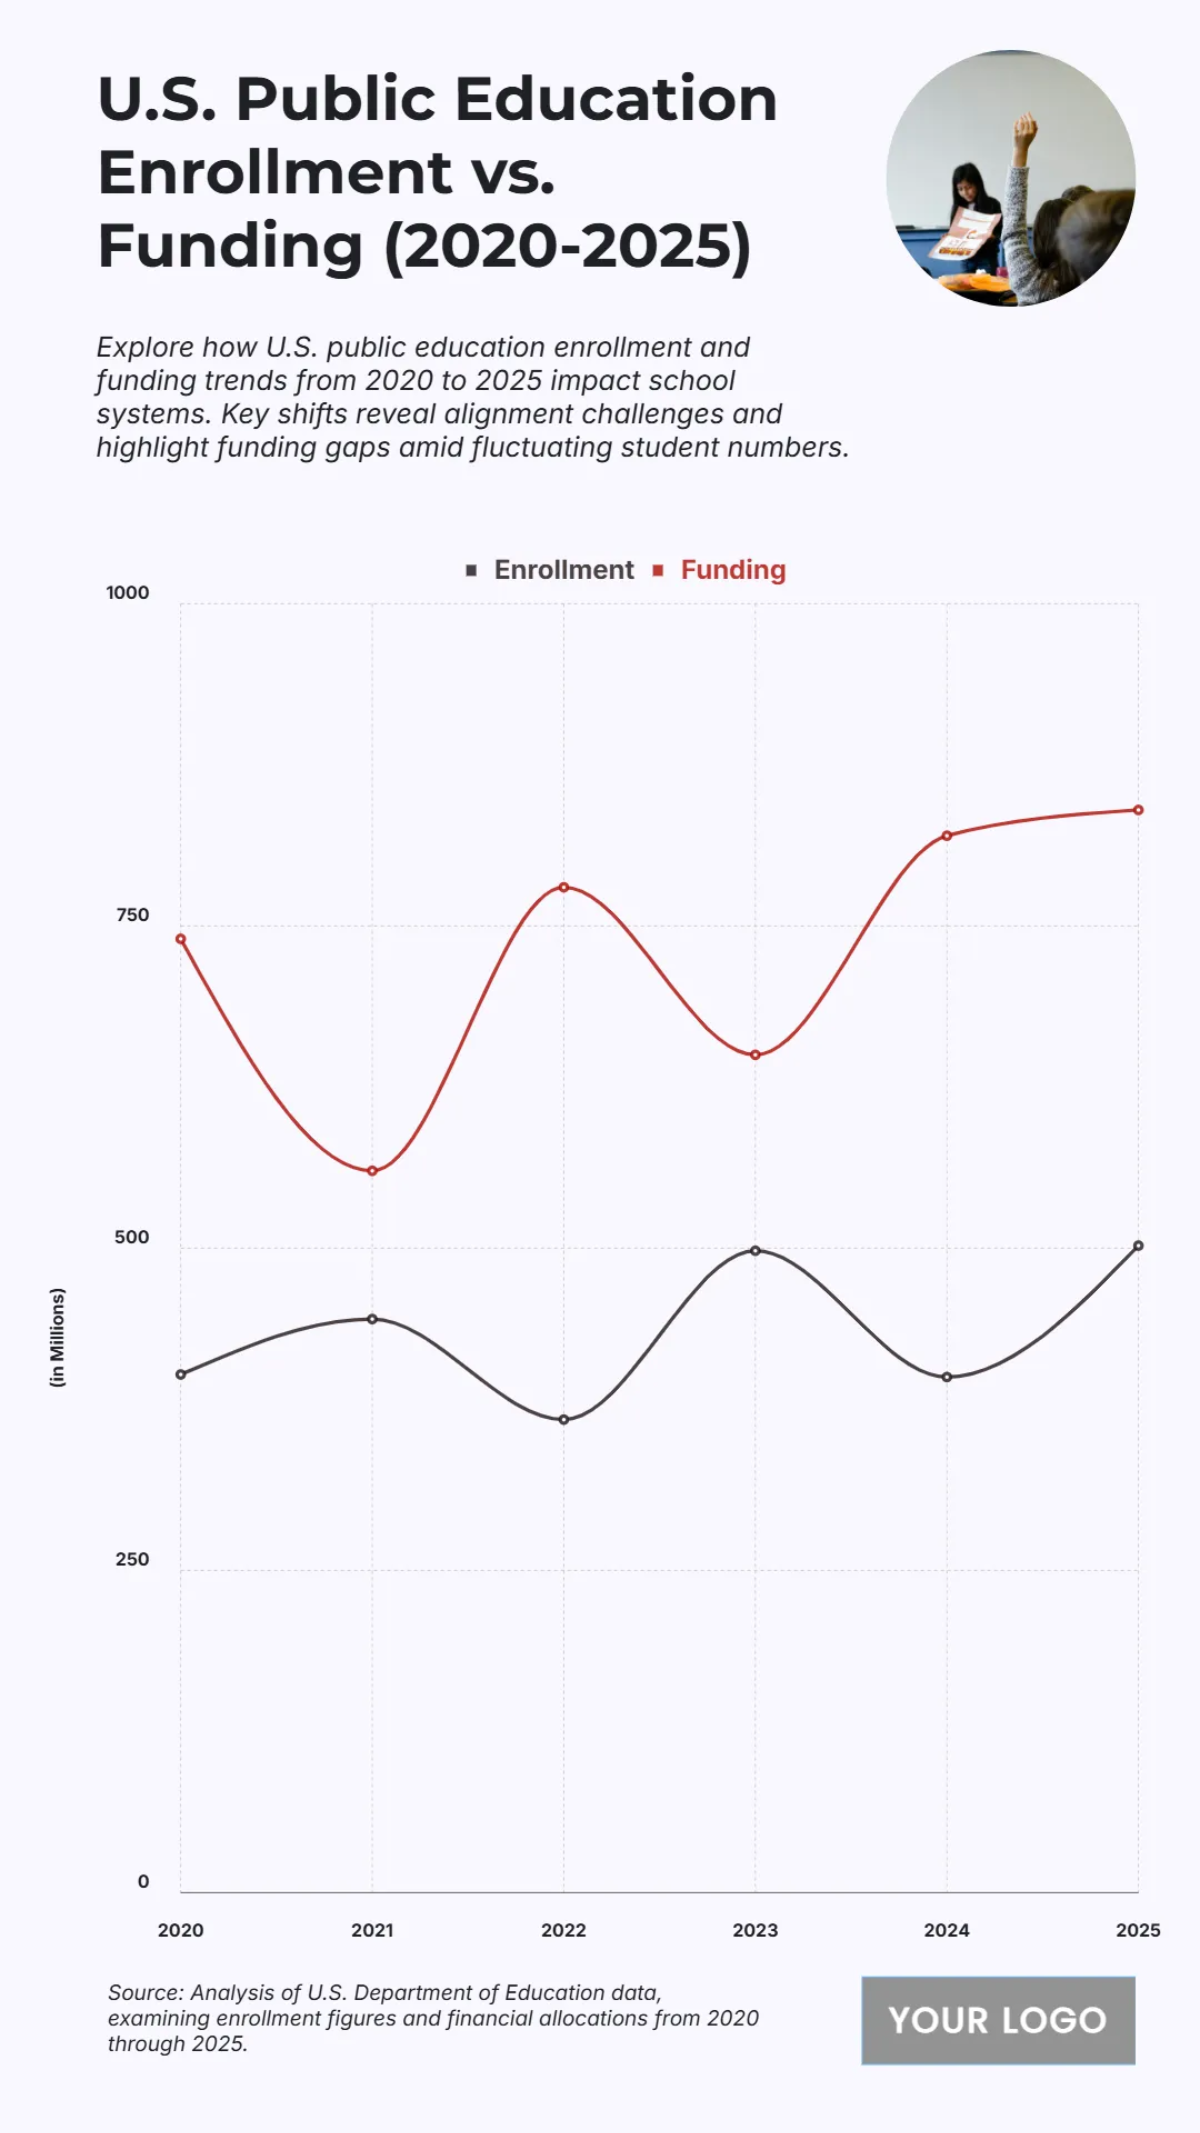
The chart compares U.S. public education enrollment and funding from 2020 to 2025, measured in millions. In 2020, enrollment stood at about 400 million while funding was higher at roughly 720 million. By 2021, enrollment increased slightly to around 450 million, but funding declined to about 550 million. In 2022, enrollment dropped back near 380 million even as funding rose again to approximately 760 million. A sharp rise in enrollment occurred in 2023, reaching nearly 490 million, while funding fell to about 650 million. By 2024, enrollment dipped to around 420 million, but funding surged to nearly 820 million. In 2025, both enrollment and funding reached their peaks, with enrollment at about 500 million and funding at roughly 850 million, underscoring widening disparities between student numbers and financial resources.
| Labels | Enrollment | Funding |
|---|---|---|
| 2020 | 402 | 740 |
| 2021 | 445 | 560 |
| 2022 | 367 | 780 |
| 2023 | 498 | 650 |
| 2024 | 400 | 820 |
| 2025 | 502 | 840 |


