Free Top 5 U.S. Renewable Energy Export Growth by Type (2015-2025) Chart
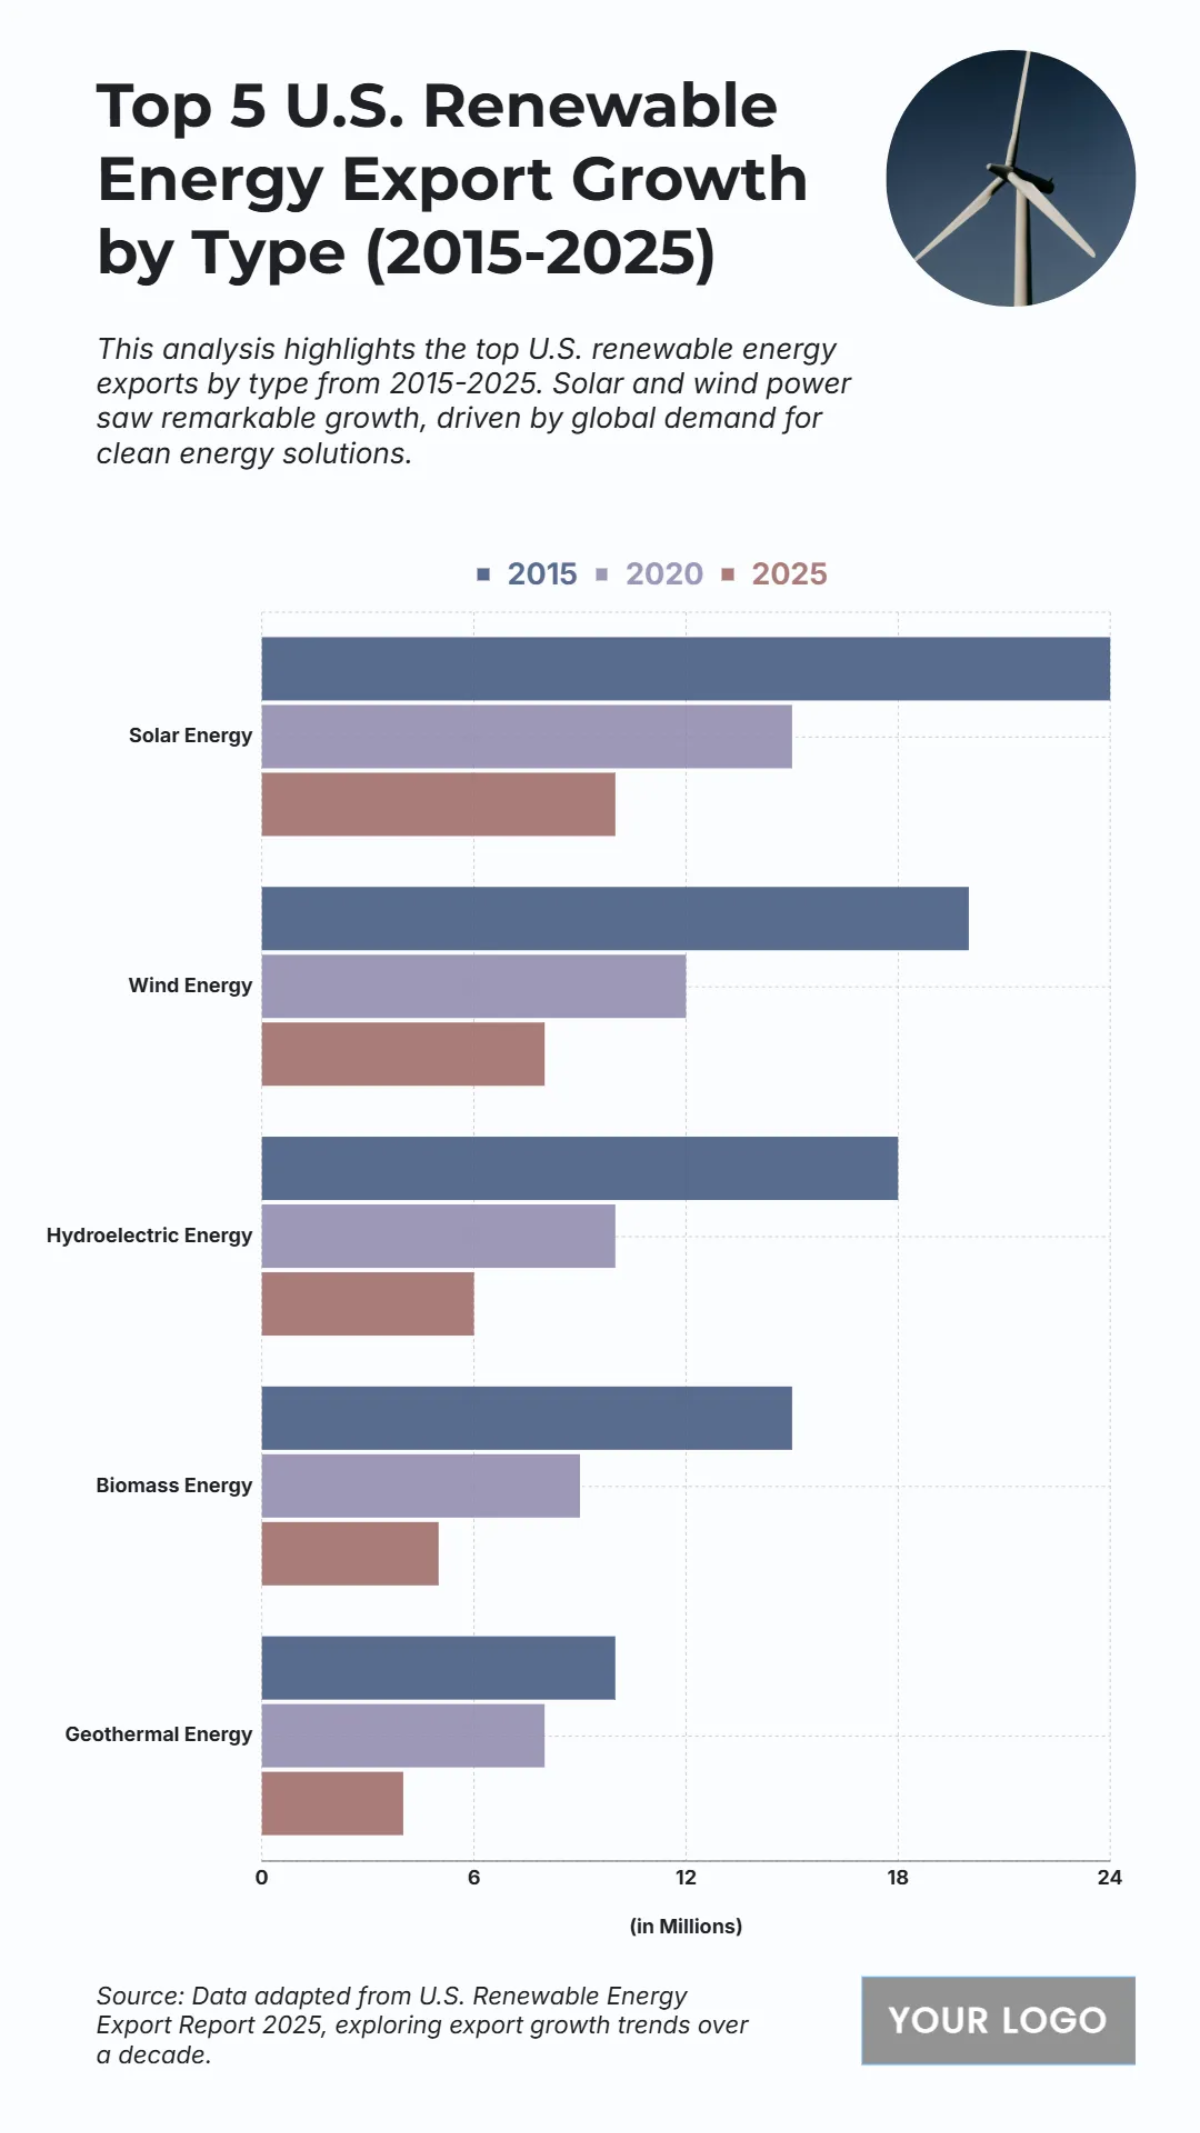
The chart presents the top five U.S. renewable energy export types by growth from 2015 to 2025, measured in millions. Solar energy shows the highest increase, rising from about 10 million in 2015 to roughly 15 million in 2020 and reaching close to 23 million in 2025. Wind energy follows, starting at around 14 million in 2015, climbing to 18 million in 2020, and nearing 20 million in 2025. Hydroelectric energy grows steadily from about 8 million in 2015 to around 12 million in 2020 and 17 million in 2025. Biomass energy rises from 5 million in 2015 to nearly 10 million in 2025, while geothermal energy shows more modest growth, increasing from 3 million in 2015 to around 8 million in 2025. Overall, solar and wind dominate export growth, reflecting global demand for clean energy solutions.
| Labels | 2015 | 2020 | 2025 |
| Solar Energy | 24 | 15 | 10 |
| Wind Energy | 20 | 12 | 8 |
| Hydroelectric Energy | 18 | 10 | 6 |
| Biomass Energy | 15 | 9 | 5 |
| Geothermal Energy | 10 | 8 | 4 |


