Free Top 20 U.S. States by Change in Unemployment Rate (2018–2025) Charts
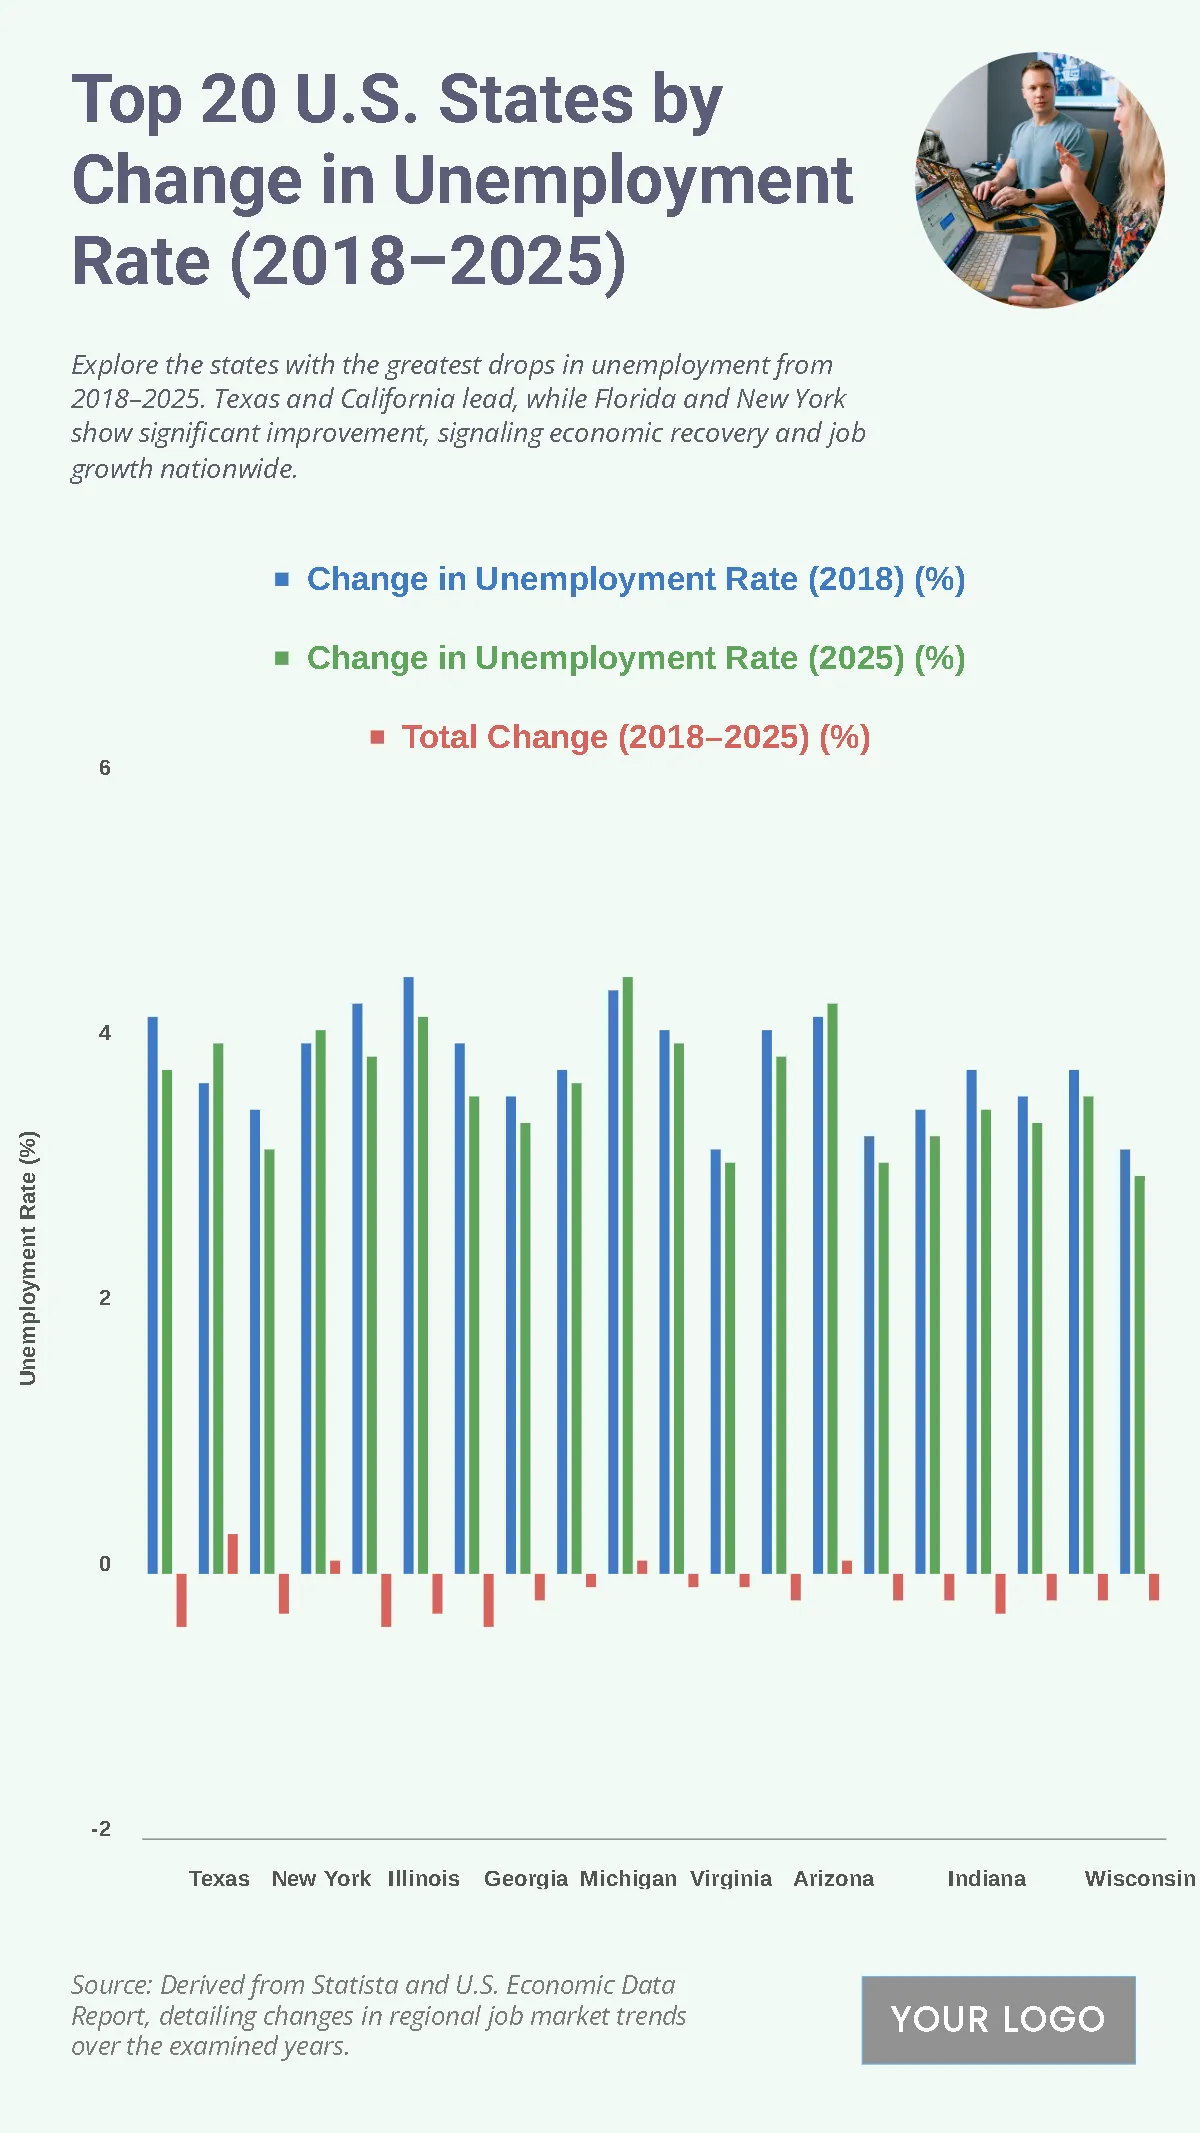
The chart illustrates the top 20 U.S. states by change in unemployment rate from 2018 to 2025, highlighting shifts between 2019, 2025, and the total change over the period. In 2019, most states recorded unemployment rates ranging between 3.5 percent and 5 percent. By 2025, the values show similar patterns, with slight reductions in several states, averaging closer to 3.5 percent. The total change from 2018 to 2025 is negative across all states, indicating consistent declines in unemployment. States such as Texas, Florida, New York, and California reflect these downward shifts, confirming overall progress in employment recovery.
| Labels | Change in Unemployment Rate (2018) (%) | Change in Unemployment Rate (2025) (%) | Total Change (2018–2025) (%) |
|---|---|---|---|
| California | 4.2 | 3.8 | -0.4 |
| Texas | 3.7 | 4.0 | 0.3 |
| Florida | 3.5 | 3.2 | -0.3 |
| New York | 4.0 | 4.1 | 0.1 |
| Pennsylvania | 4.3 | 3.9 | -0.4 |
| Illinois | 4.5 | 4.2 | -0.3 |
| Ohio | 4.0 | 3.6 | -0.4 |
| Georgia | 3.6 | 3.4 | -0.2 |
| North Carolina | 3.8 | 3.7 | -0.1 |
| Michigan | 4.4 | 4.5 | 0.1 |


