Free U.S. Consumer Credit Card Usage by Transaction Type (2020-2025)
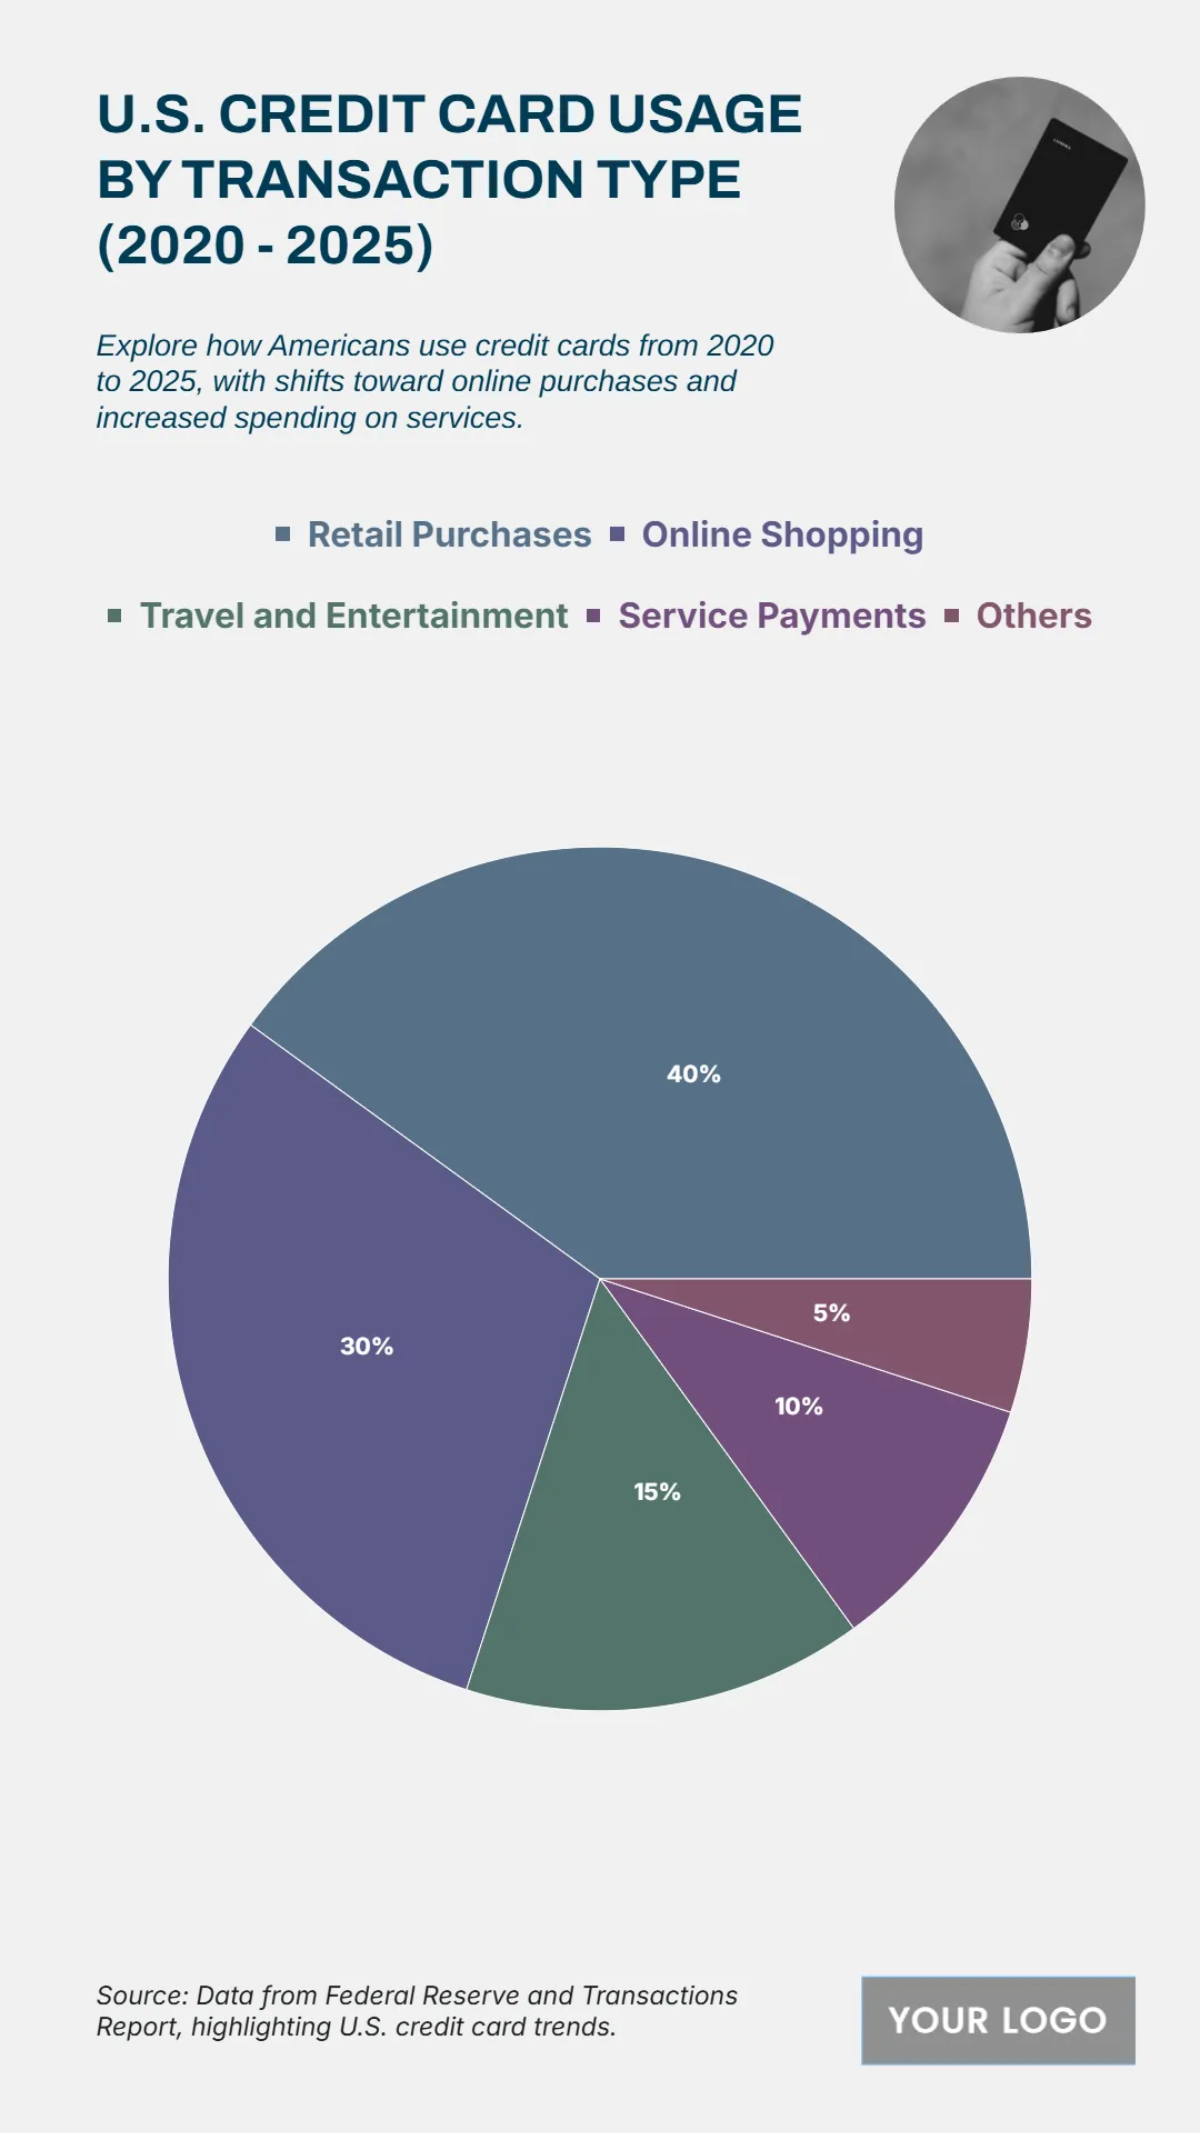
The chart presents the distribution of U.S. credit card usage across various transaction types from 2020 to 2025, emphasizing how Americans allocate their spending. Retail Purchases account for the largest share at 40%, indicating that traditional consumer spending in physical stores continues to dominate credit card use. Online Shopping follows closely with 30%, reflecting the significant rise of e-commerce and digital purchasing behavior during and after the pandemic years. Travel and Entertainment transactions contribute 15%, showing gradual recovery as post-pandemic travel and leisure activities resume. Service Payments make up 10%, representing recurring transactions such as utilities, subscriptions, and other essential services. Lastly, Others comprise 5%, covering miscellaneous or less frequent expenditures. The data highlights a clear shift toward digital commerce and convenience-based spending, while still maintaining strong usage in retail sectors. This trend suggests that both online and offline spending habits coexist, with consumers balancing convenience, lifestyle, and necessity. Overall, the chart underscores a steady growth in credit card reliance as a primary payment method, supported by evolving financial habits and increasing digital integration in daily consumer activities.
| Labels | Percentage |
|---|---|
| Retail Purchases | 40% |
| Online Shopping | 30% |
| Travel and Entertainment | 15% |
| Service Payments | 10% |
| Others | 5% |


