Free Top 20 U.S. States by Regional Inflation Variations (2020-2025)
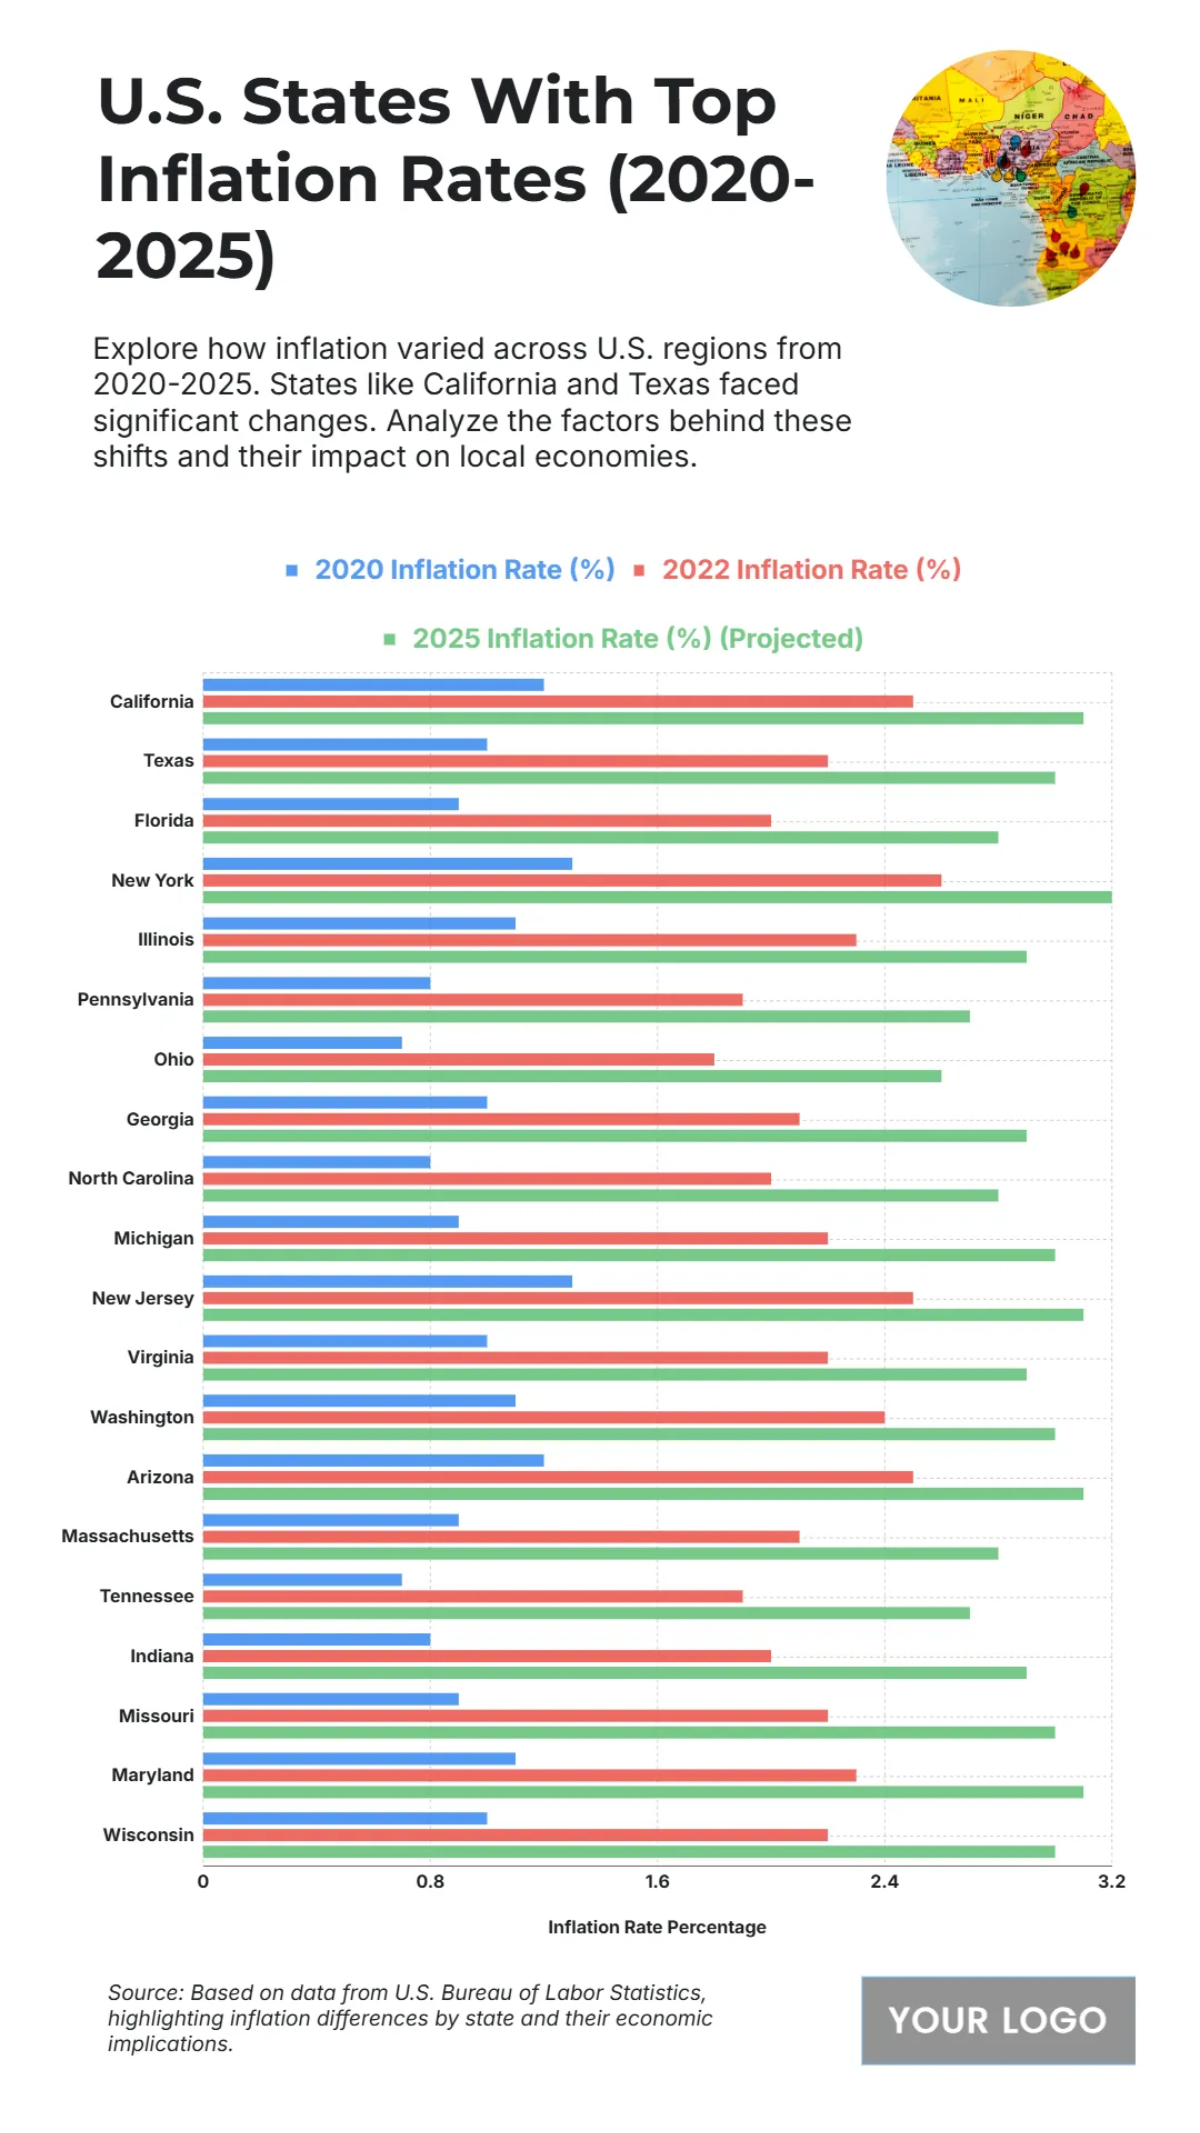
The provided chart illustrates the variation in inflation rates across several U.S. states from 2020 to 2025, highlighting significant shifts and projected changes in local economies. Analyzing the data for 2020, 2022, and the projected 2025 inflation rates reveals clear trends in price increases. For instance, California, a large economy, saw its inflation rate change from a moderate level in 2020 to a significantly higher rate in 2022, and it is projected to maintain one of the highest rates in 2025, possibly near the 3.0 percent mark. Similarly, Texas experienced a sharp increase in its inflation rate between 2020 and 2022, with its 2025 projection also placing it among the states with the highest expected inflation, again approaching 3.0 percent. Florida also follows this trend, showing a steep climb in its inflation rate from 2020 to the projected 2025 value. Comparing the states, the data suggests that in 2022, the inflation rate (represented by the red bar) was substantially higher across the board for nearly all listed states compared to the 2020 rate (blue bar). Looking ahead to the projected 2025 rates (green bar), many states, including California, Texas, Florida, New York, and Wisconsin, are expected to see their inflation rates hover around or even slightly exceed the peak 2022 rates, suggesting persistent or even accelerating inflationary pressures in these regions. The source notes that the data is based on the U.S. Bureau of Labor Statistics, emphasizing the state-by-state differences and their economic implications.
| Labels | 2020 Inflation Rate (%) | 2022 Inflation Rate (%) |
2025 Inflation Rate (%) (Projected) |
| California | 1.2 | 2.5 | 3.1 |
| Texas | 1 | 2.2 | 3 |
| Florida | 0.9 | 2 | 2.8 |
| New York | 1.3 | 2.6 | 3.2 |
| Illinois | 1.1 | 2.3 | 2.9 |
| Pennsylvania | 0.8 | 1.9 | 2.7 |
| Ohio | 0.7 | 1.8 | 2.6 |
| Georgia | 1 | 2.1 | 2.9 |
| North Carolina | 0.8 | 2 | 2.8 |
| Michigan | 0.9 | 2.2 | 3 |
| New Jersey | 1.3 | 2.5 | 3.1 |
| Virginia | 1 | 2.2 | 2.9 |
| Washington | 1.1 | 2.4 | 3 |
| Arizona | 1.2 | 2.5 | 3.1 |
| Massachusetts | 0.9 | 2.1 | 2.8 |
| Tennessee | 0.7 | 1.9 | 2.7 |
| Indiana | 0.8 | 2 | 2.9 |
| Missouri | 0.9 | 2.2 | 3 |
| Maryland | 1.1 | 2.3 | 3.1 |
| Wisconsin | 1 | 2.2 | 3 |


