Free U.S. Average Household Technology Spending (2015-2025)
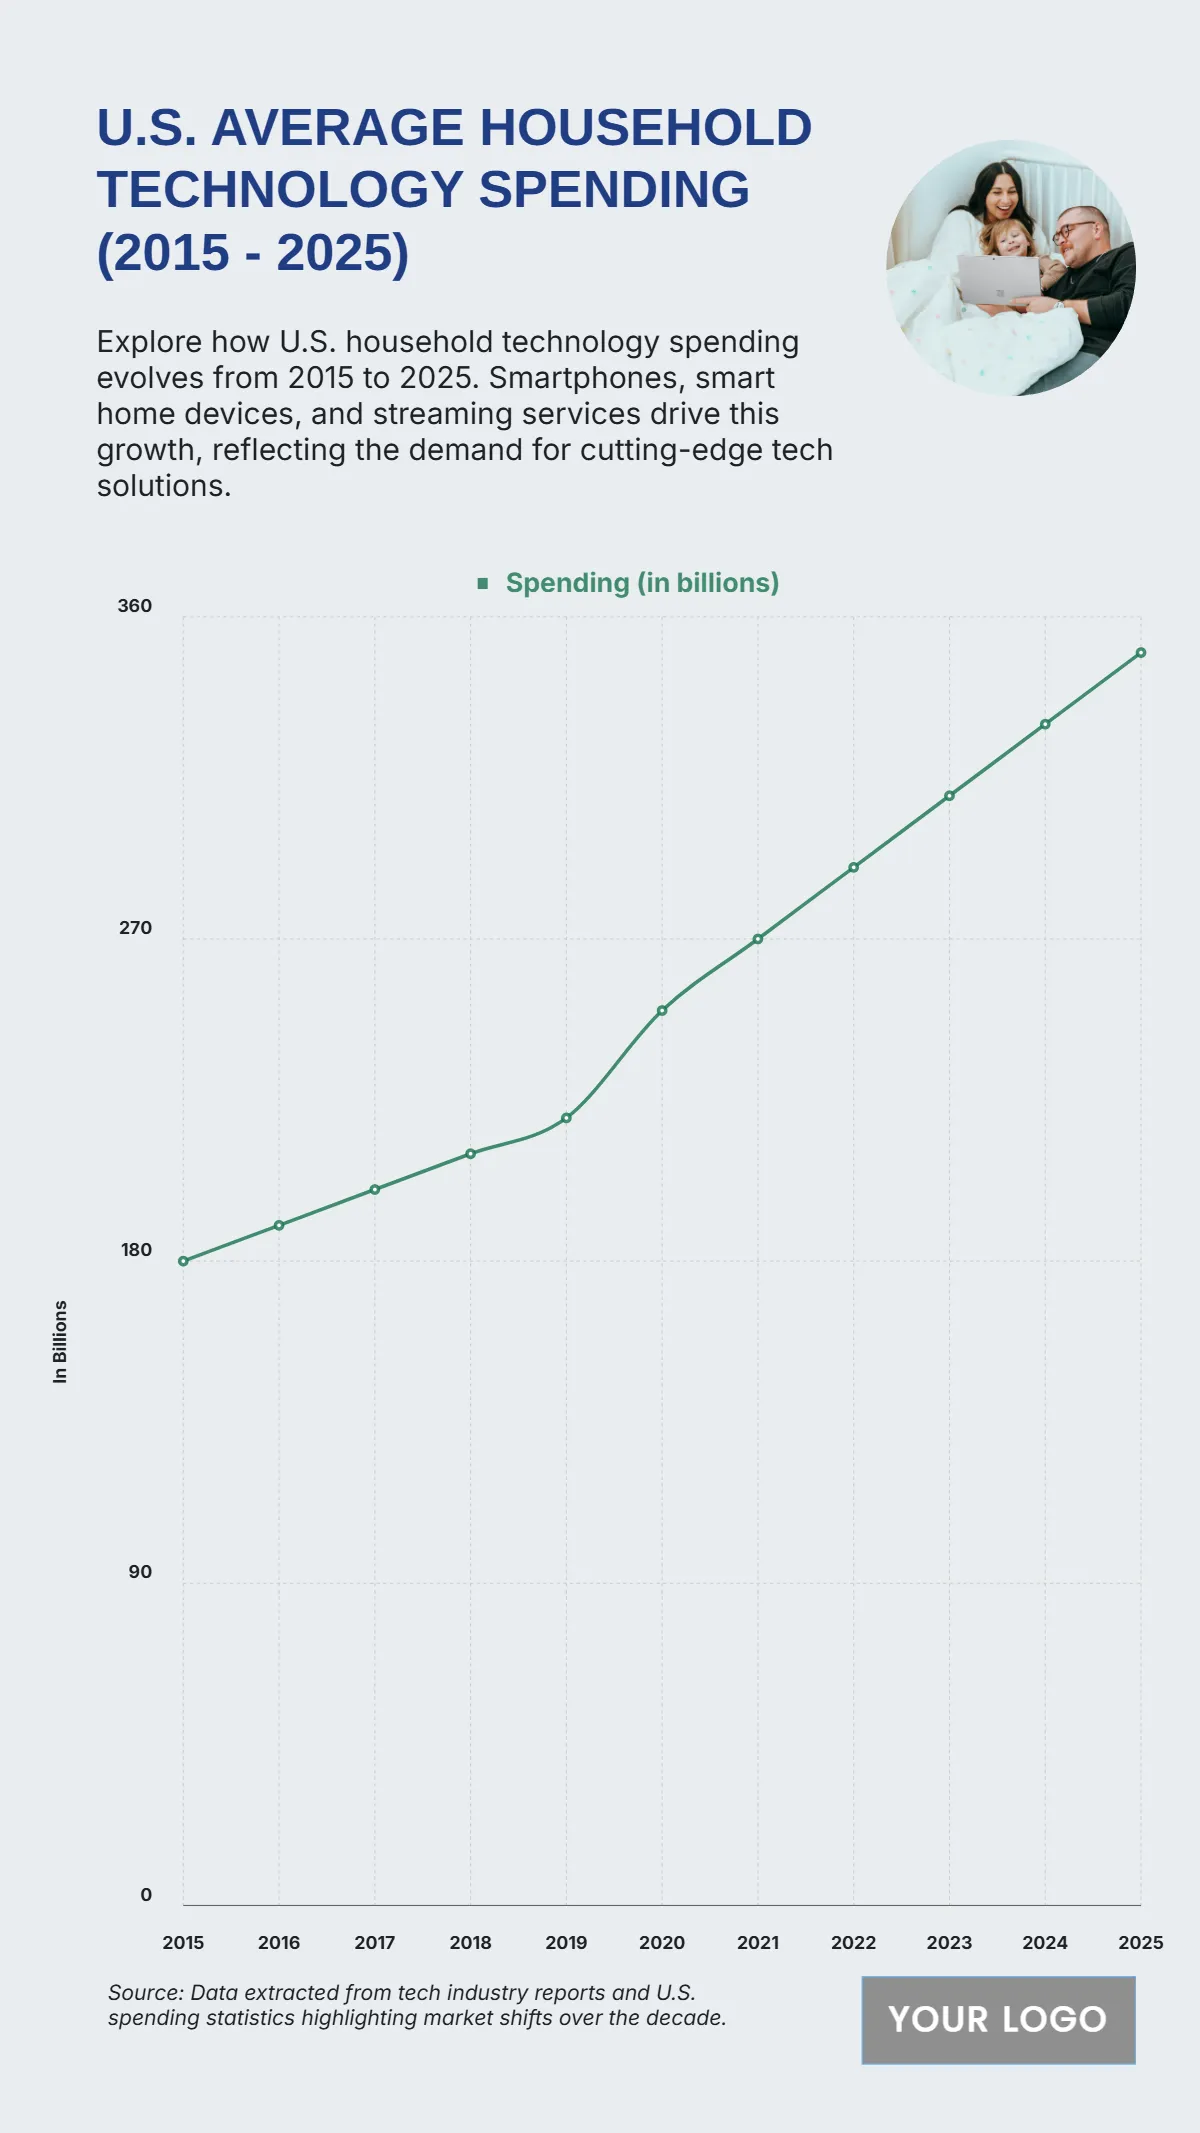
The chart shows a steady rise in U.S. average household technology spending from 2015 to 2025, driven by the growing demand for smart devices, streaming services, and digital innovations. In 2015, spending stood at $180 billion, gradually increasing to $190 billion in 2016 and $200 billion in 2017. The upward trend continued with $210 billion in 2018 and $220 billion in 2019, before a sharper rise to $250 billion in 2020, reflecting increased tech adoption during the pandemic. By 2021, spending climbed to $270 billion, followed by consistent growth reaching $290 billion in 2022, $310 billion in 2023, and $330 billion in 2024. The projected amount for 2025 peaks at $350 billion, marking nearly a 95% increase over the decade. This continuous growth underscores the increasing role of technology in everyday American life, from home automation and communication tools to entertainment and digital connectivity.
| Labels | Spending (in billions) |
|---|---|
| 2015 | 180 |
| 2016 | 190 |
| 2017 | 200 |
| 2018 | 210 |
| 2019 | 220 |
| 2020 | 250 |
| 2021 | 270 |
| 2022 | 290 |
| 2023 | 310 |
| 2024 | 330 |
| 2025 | 350 |


