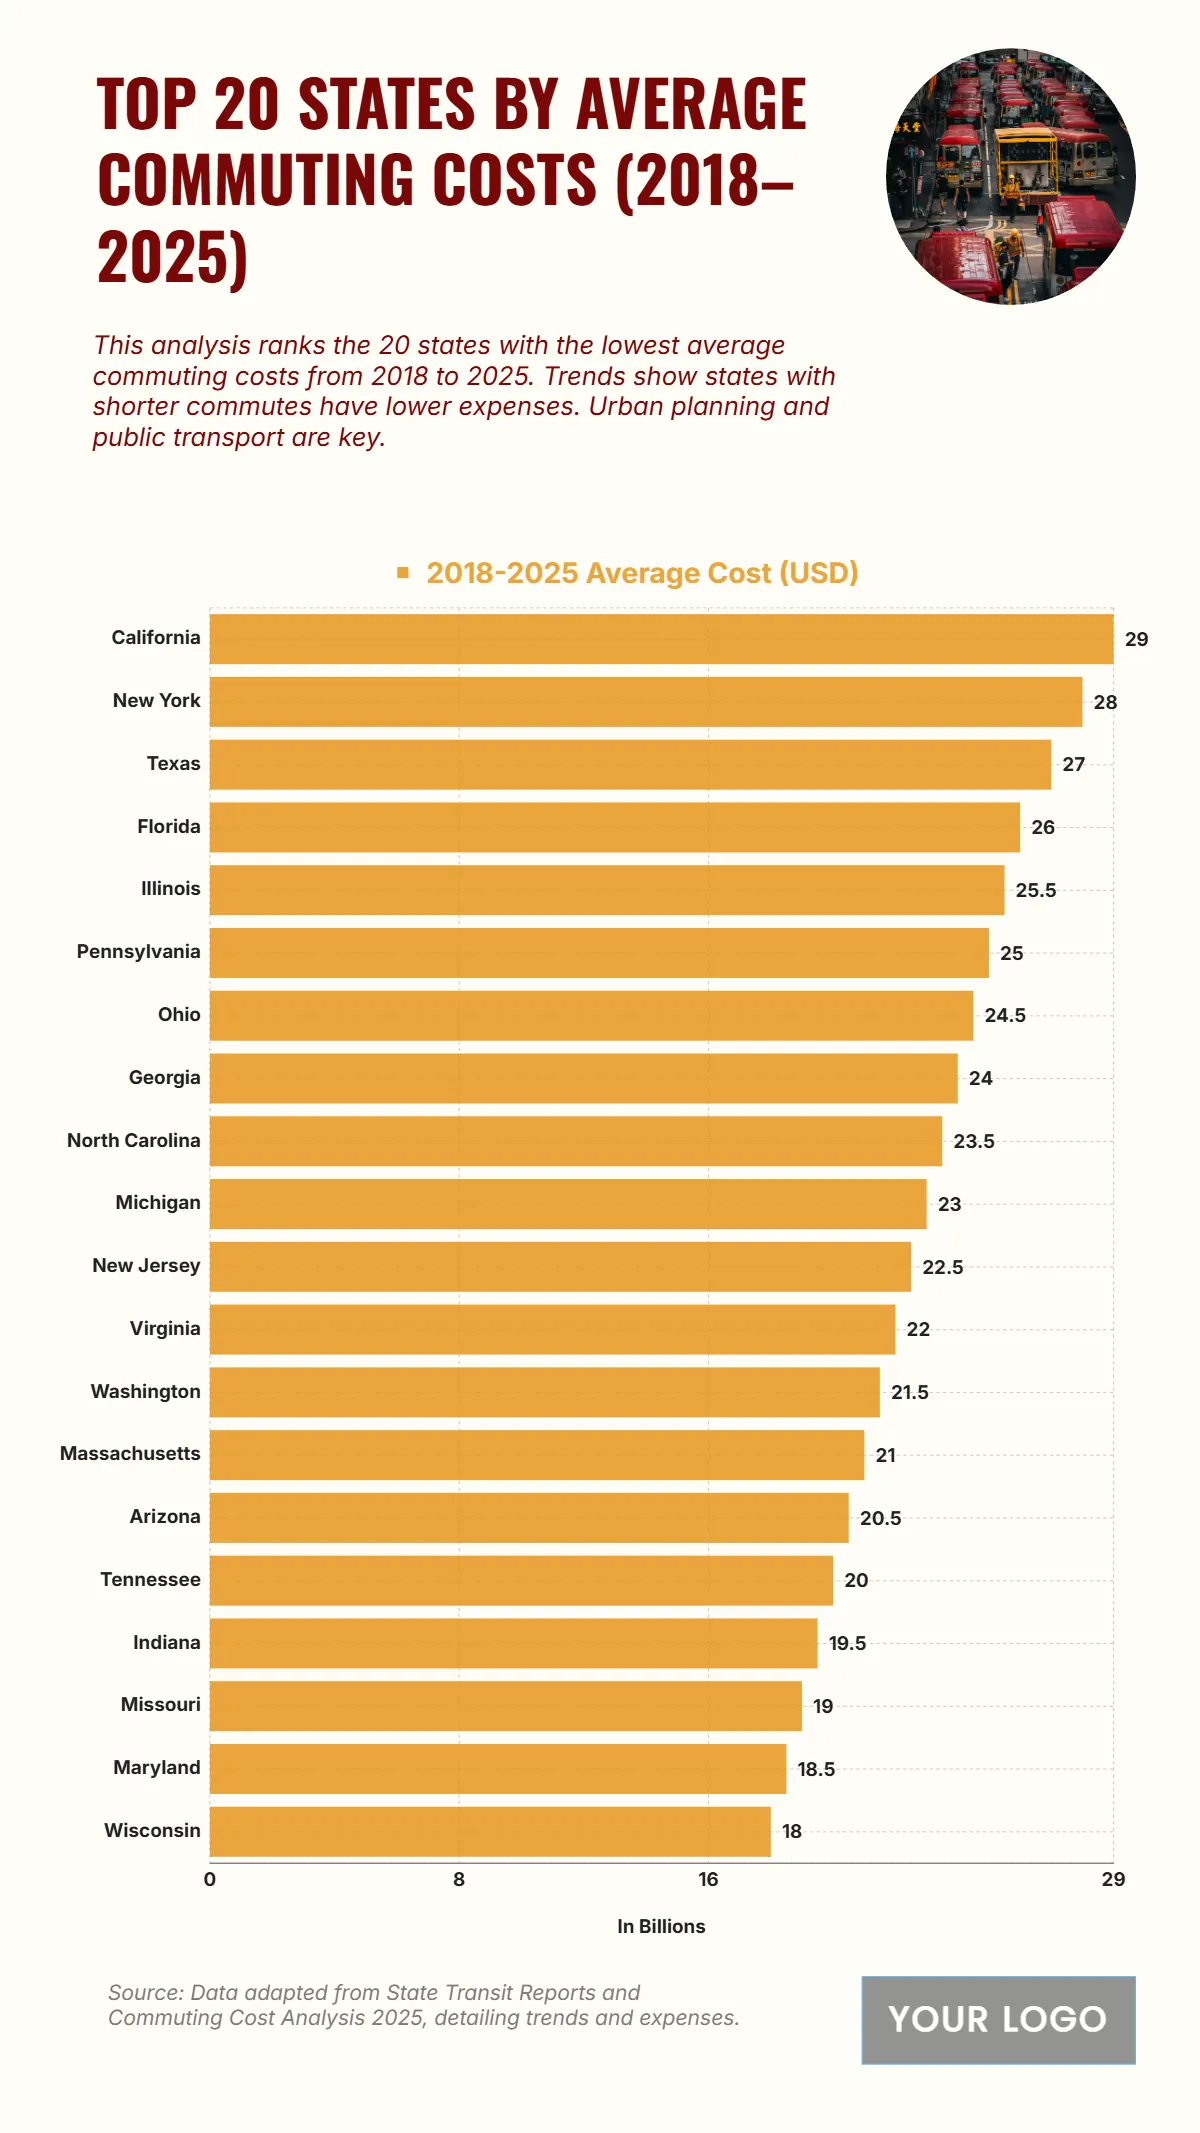
Free Top 20 States by Average Commuting Costs (2018–2025) Chart
The chart illustrates the states with the highest average commuting costs in the U.S. from 2018 to 2025, emphasizing differences in transportation expenses across regions. California records the highest average cost at USD 29, followed closely by New York (USD 28) and Texas (USD 27), reflecting the financial burden of commuting in highly urbanized and congested areas. Florida (USD 26) and Illinois (USD 25.5) also show considerable expenses due to long-distance travel and reliance on private transport. States such as Pennsylvania (USD 25), Ohio (USD 24.5), and Georgia (USD 24) remain moderately high, while North Carolina (USD 23.5) and Michigan (USD 23) maintain mid-level costs. Toward the lower end, New Jersey (USD 22.5), Virginia (USD 22), and Washington (USD 21.5) demonstrate slightly reduced commuting costs. The lowest expenses are seen in Massachusetts (USD 21), Arizona (USD 20.5), Tennessee (USD 20), and Wisconsin (USD 18), showcasing more efficient or affordable commuting structures.
| Labels | 2018–2025 Average Cost (USD) |
|---|---|
| California | 29 |
| New York | 28 |
| Texas | 27 |
| Florida | 26 |
| Illinois | 25.5 |
| Pennsylvania | 25 |
| Ohio | 24.5 |
| Georgia | 24 |
| North Carolina | 23.5 |
| Michigan | 23 |
| New Jersey | 22.5 |
| Virginia | 22 |
| Washington | 21.5 |
| Massachusetts | 21 |
| Arizona | 20.5 |
| Tennessee | 20 |
| Indiana | 19.5 |
| Missouri | 19 |
| Maryland | 18.5 |
| Wisconsin | 18 |


