Free Top 20 U.S. States by Exports per Capita (2020–2025) Chart
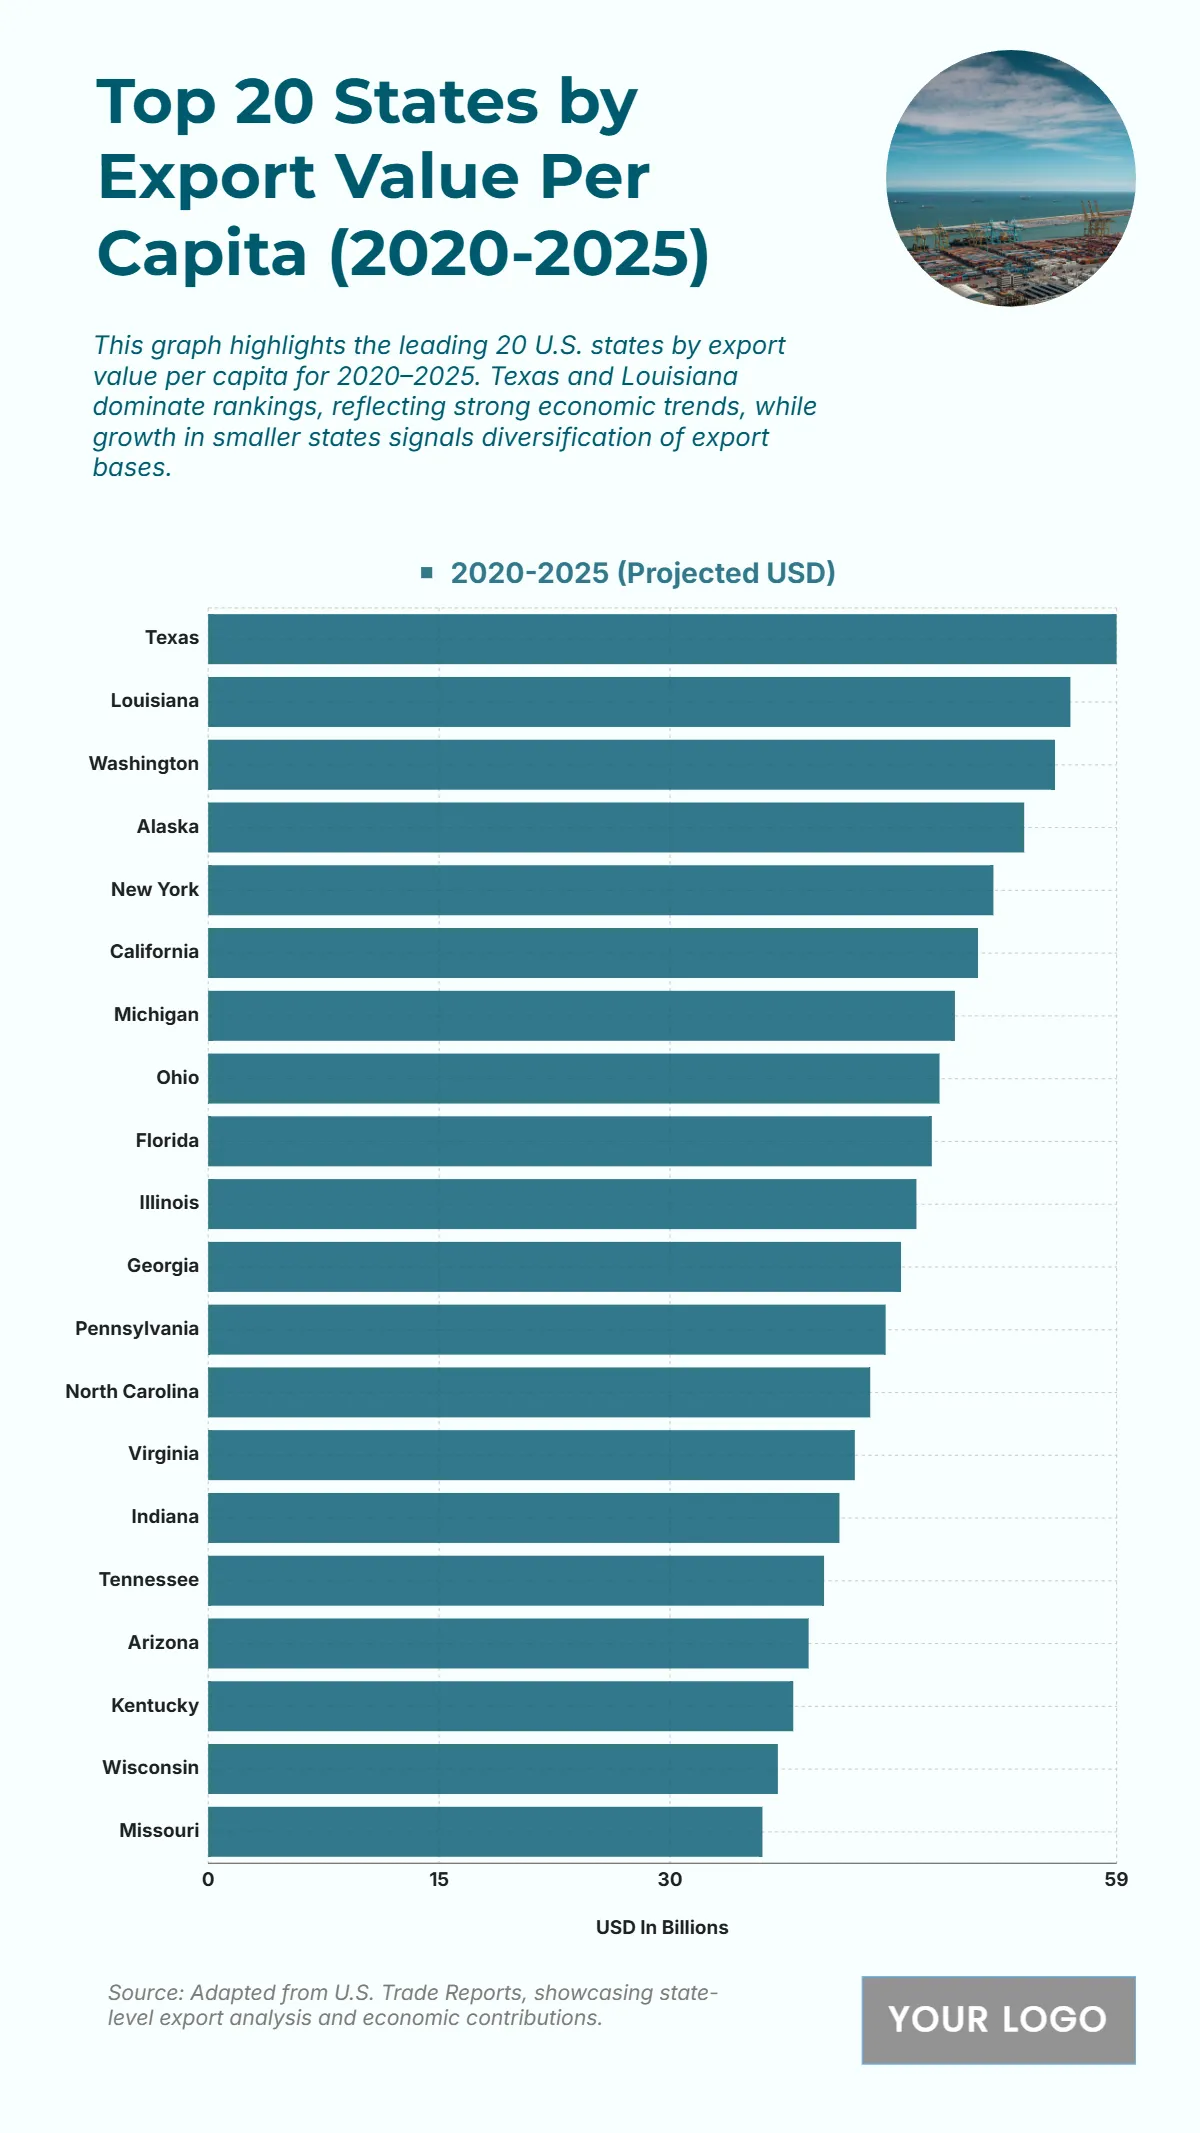
The chart showcases the projected export value per capita across the top 20 U.S. states from 2020 to 2025, emphasizing the dominant role of key trade hubs and growing diversification among smaller states. Texas leads the nation with an estimated USD 59 billion, driven by energy exports and industrial production. Louisiana follows at USD 56 billion, benefiting from its strong petrochemical and port activities. Washington ranks third with USD 55 billion, supported by technology and aircraft manufacturing exports. Alaska (USD 53 billion) and New York (USD 51 billion) continue to perform strongly due to natural resources and financial exports. California follows at USD 50 billion, highlighting its diversified export base. Other notable states include Michigan (USD 48.5 billion), Ohio (USD 47.5 billion), and Florida (USD 47 billion). Toward the lower end, Wisconsin (USD 37 billion) and Missouri (USD 36 billion) still show solid export activity, reflecting expanding manufacturing and agricultural trade.
| Labels | 2020–2025 (Projected USD) |
|---|---|
| Texas | 59 |
| Louisiana | 56 |
| Washington | 55 |
| Alaska | 53 |
| New York | 51 |
| California | 50 |
| Michigan | 48.5 |
| Ohio | 47.5 |
| Florida | 47 |
| Illinois | 46 |
| Georgia | 45 |
| Pennsylvania | 44 |
| North Carolina | 43 |
| Virginia | 42 |
| Indiana | 41 |
| Tennessee | 40 |
| Arizona | 39 |
| Kentucky | 38 |
| Wisconsin | 37 |
| Missouri | 36 |


