Free U.S. Top 10 States with the Most Significant Income Growth (2020–2025) Chart
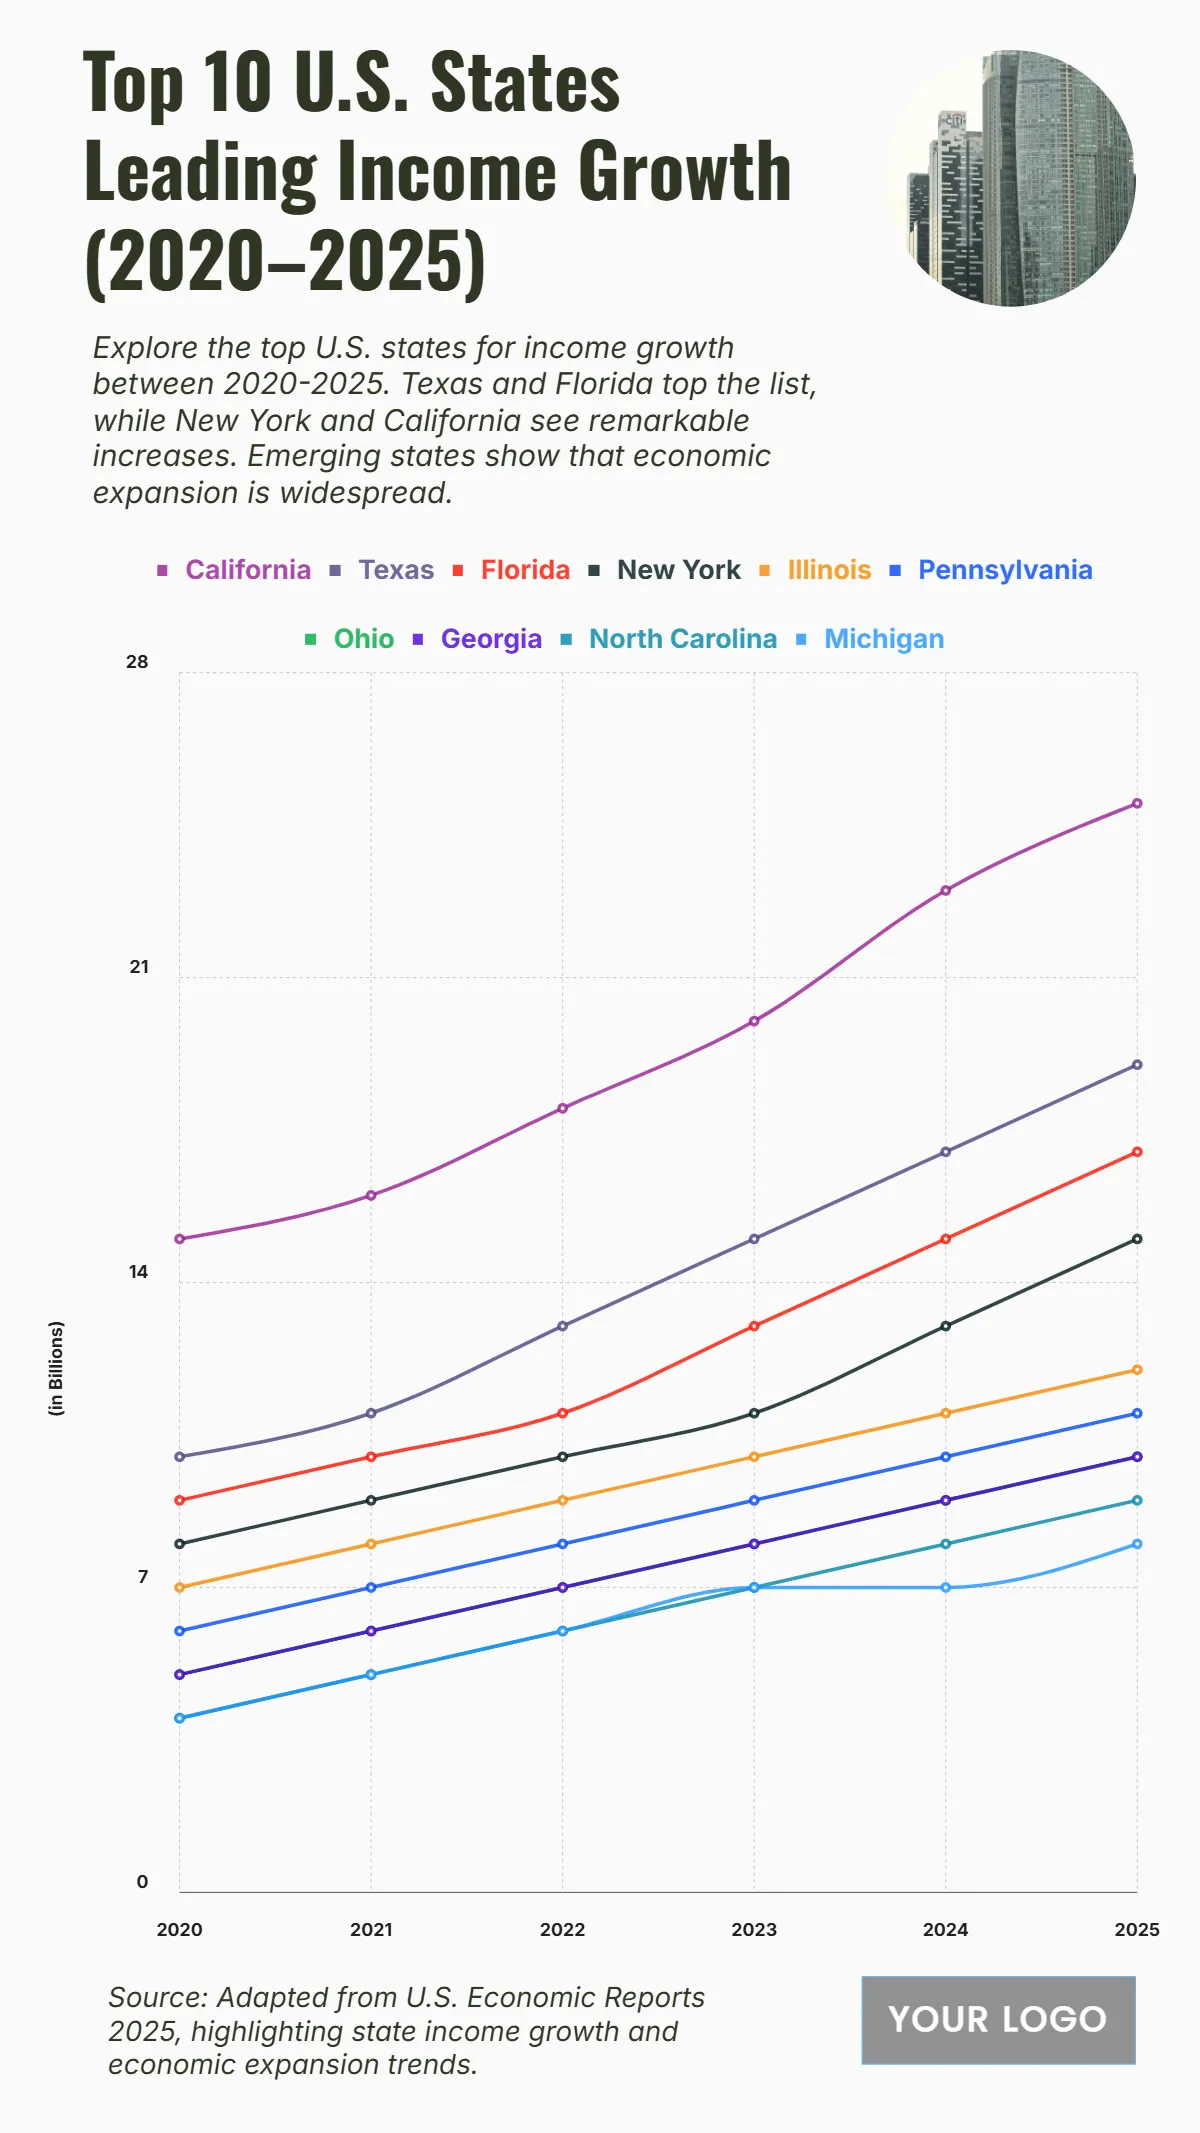
The chart illustrates the steady rise in income growth across ten U.S. states from 2020 to 2025, with significant upward trends in major economic hubs. California leads the nation, increasing from 15% in 2020 to 25% in 2025, reflecting strong technology and service sector expansion. Texas follows, growing from 10% to 19%, driven by industrial and energy diversification. Florida climbs from 9% to 17%, supported by tourism and infrastructure development, while New York advances from 8% to 15%, indicating a solid rebound in urban employment and finance. Illinois and Pennsylvania reach 12% and 11% respectively by 2025, showing consistent gains. Ohio improves from 5% to 10%, while southern states like Georgia (5% to 10%) and North Carolina (4% to 9%) demonstrate notable regional expansion. Michigan also shows progress, moving from 4% to 8%, underscoring the broad-based economic growth and nationwide income acceleration through 2025.
| Year | California | Texas | Florida | New York | Illinois | Pennsylvania | Ohio | Georgia | North Carolina | Michigan |
|---|---|---|---|---|---|---|---|---|---|---|
| 2020 | 15 | 10 | 9 | 8 | 7 | 6 | 5 | 5 | 4 | 4 |
| 2021 | 16 | 11 | 10 | 9 | 8 | 7 | 6 | 6 | 5 | 5 |
| 2022 | 18 | 13 | 11 | 10 | 9 | 8 | 8 | 7 | 6 | 6 |
| 2023 | 20 | 15 | 13 | 11 | 10 | 9 | 8 | 8 | 7 | 7 |
| 2024 | 23 | 17 | 15 | 13 | 11 | 10 | 9 | 9 | 8 | 7 |
| 2025 | 25 | 19 | 17 | 15 | 12 | 11 | 10 | 10 | 9 | 8 |


