Free Top 10 States by Corporate Research & Development Spending (2020–2025)
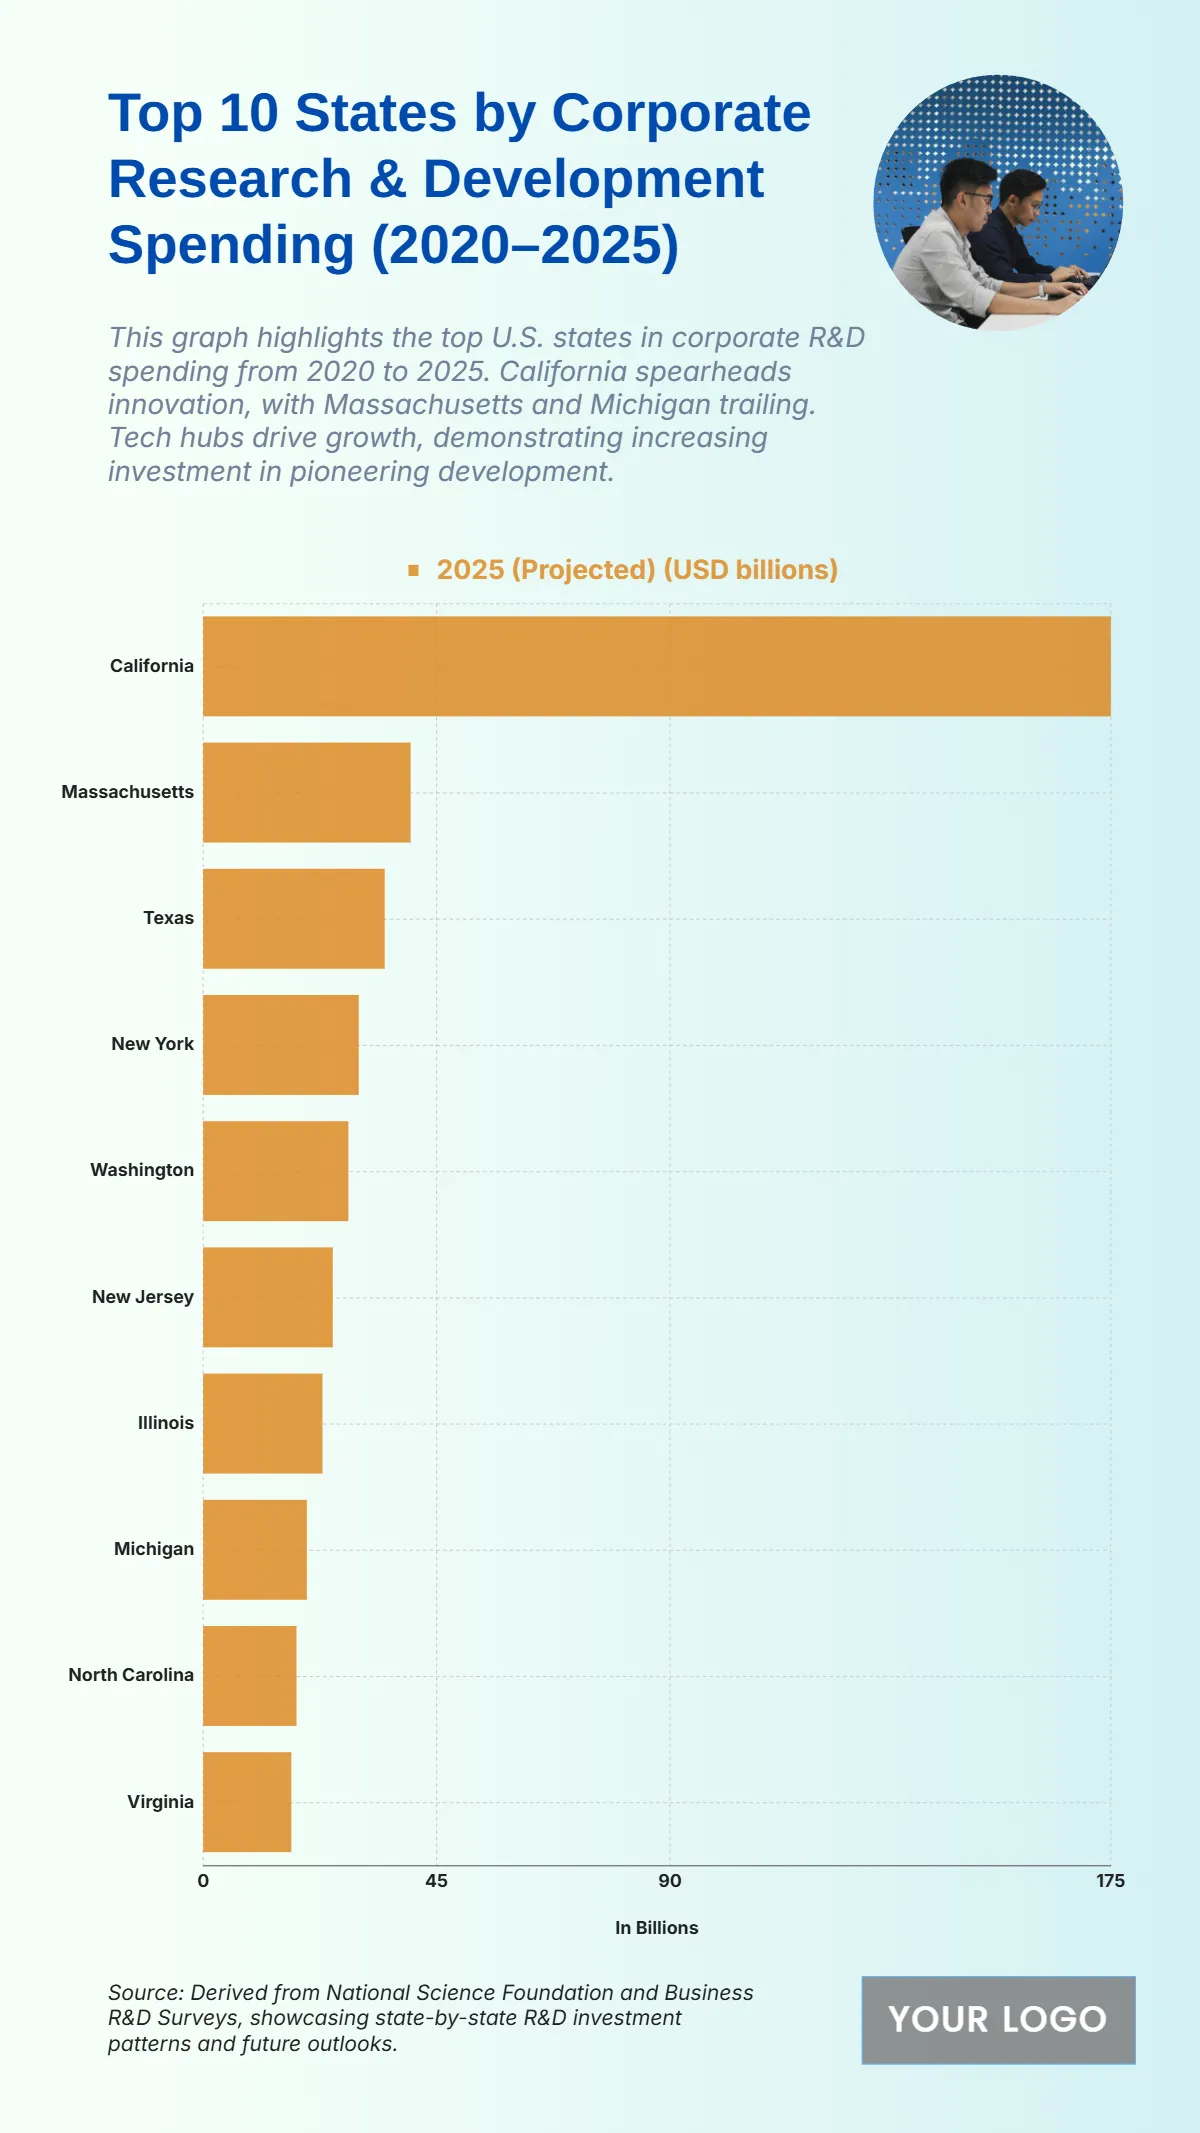
The chart illustrates the top 10 U.S. states projected for corporate research and development (R&D) spending by 2025, reflecting strong regional investments in innovation and technology. California leads by a substantial margin with $175 billion, underscoring its dominance in the tech and innovation sectors, particularly Silicon Valley’s contribution to global R&D. Massachusetts follows at $40 billion, driven by its biotechnology and academic research hubs. Texas, with $35 billion, shows growth in energy, technology, and manufacturing innovation. New York records $30 billion, supported by advancements in finance, healthcare, and tech development. Washington posts $28 billion, reflecting the impact of global tech giants based in the state. New Jersey contributes $25 billion, followed by Illinois with $23 billion, both highlighting steady corporate investments. Michigan at $20 billion continues to lead automotive R&D, while North Carolina and Virginia, with $18 billion and $17 billion respectively, demonstrate expanding innovation ecosystems and growing technological industries across the southeast region.
| Labels | 2025 (Projected) (USD billions) |
|---|---|
| California | 175 |
| Massachusetts | 40 |
| Texas | 35 |
| New York | 30 |
| Washington | 28 |
| New Jersey | 25 |
| Illinois | 23 |
| Michigan | 20 |
| North Carolina | 18 |
| Virginia | 17 |


