Free Top 20 U.S. States by Average Homeownership Rate (2018–2025)
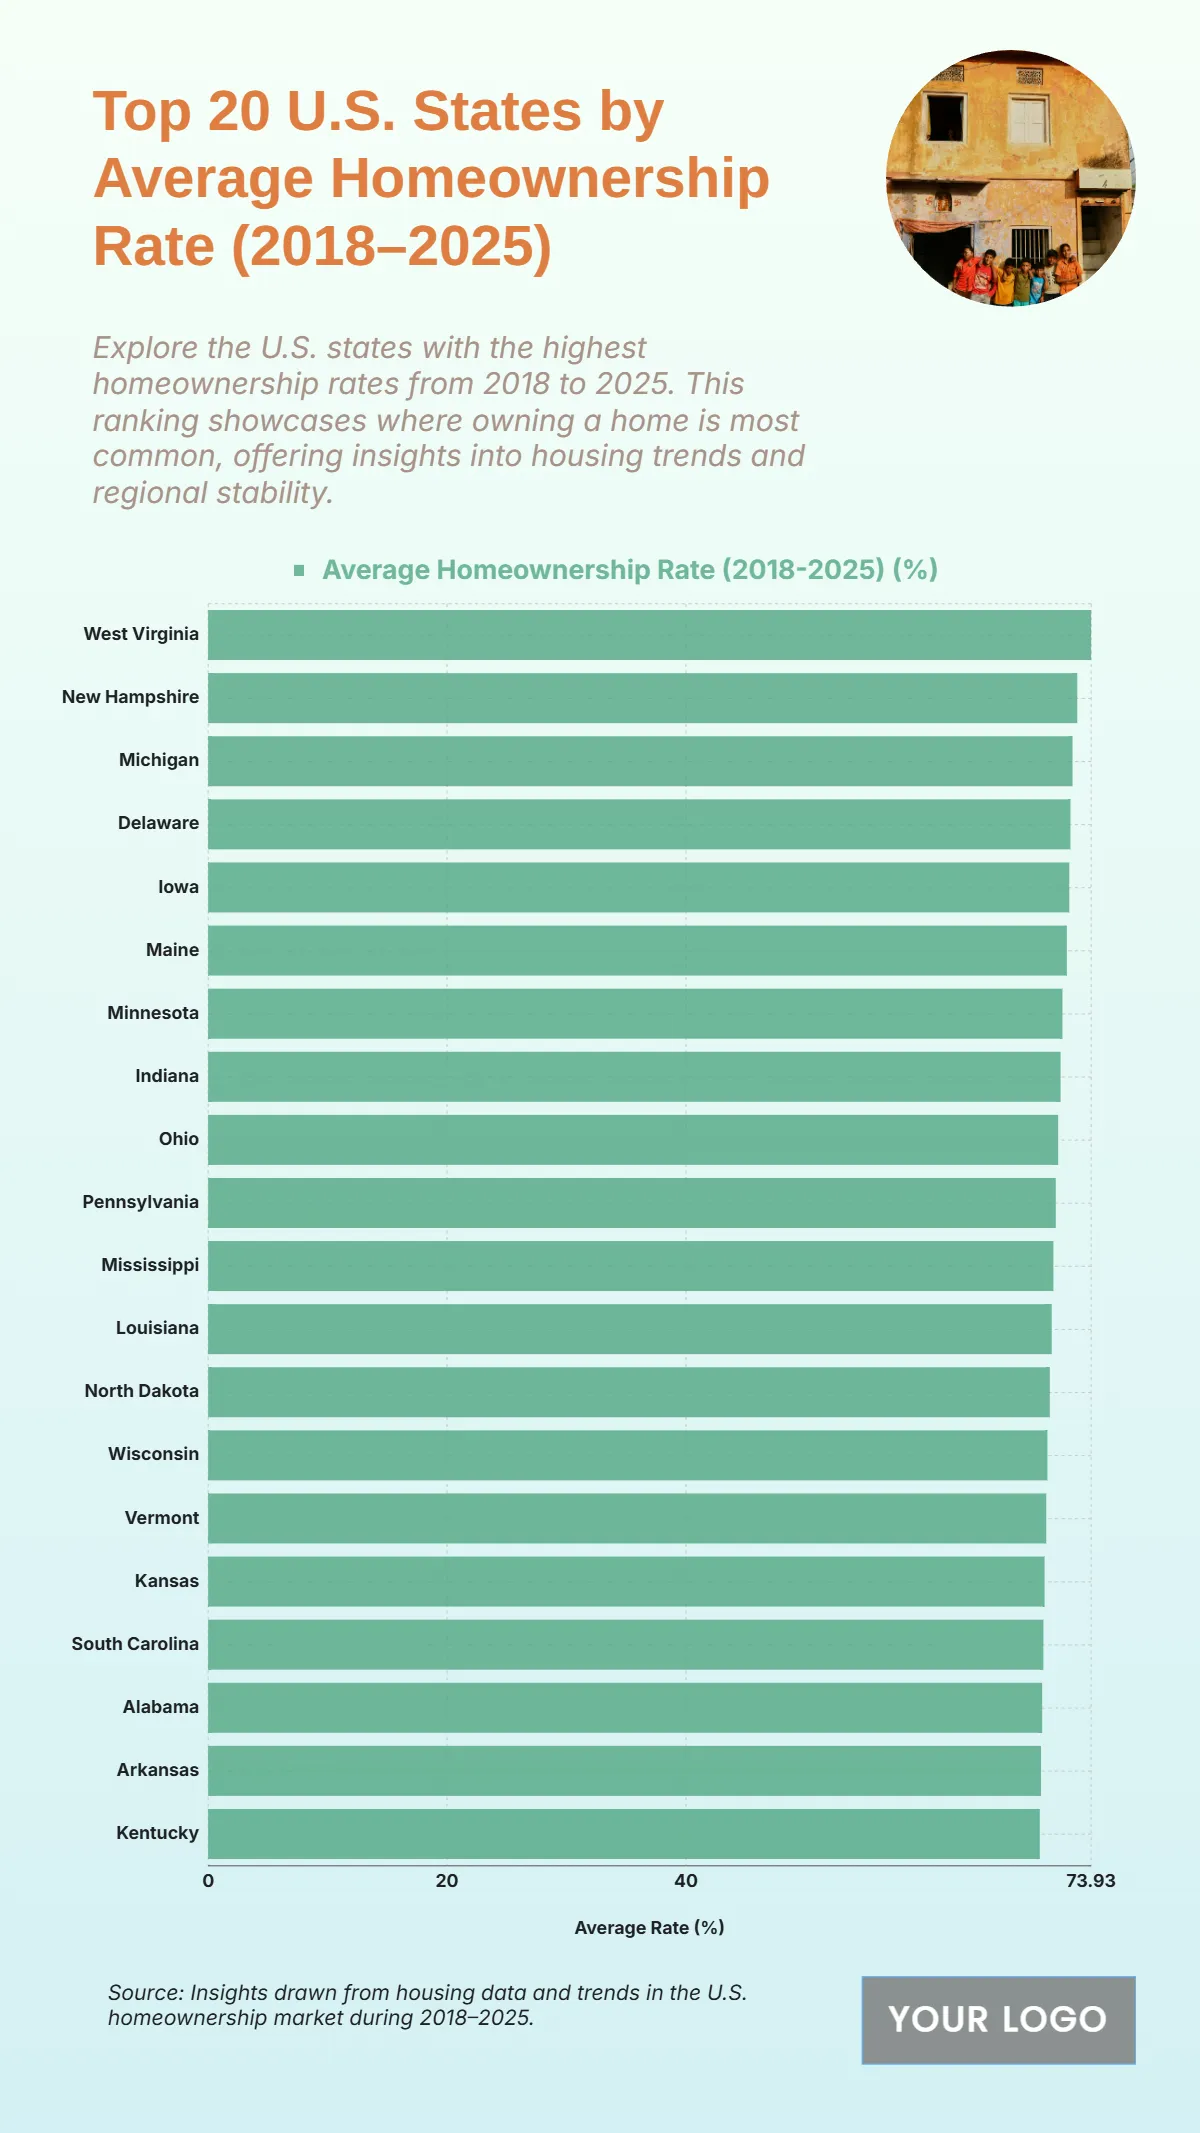
The chart highlights the top 20 U.S. states with the highest average homeownership rates from 2018 to 2025, showcasing regions where owning a home is most common. West Virginia leads with an impressive 73.93%, reflecting strong affordability and stable housing conditions. New Hampshire follows at 72.77%, supported by steady employment and favorable housing markets. Michigan ranks third with 72.37%, showing consistent homeownership across the Midwest. Delaware (72.2%), Iowa (72.1%), and Maine (71.9%) also maintain robust rates. Minnesota (71.53%), Indiana (71.37%), and Ohio (71.17%) display balanced markets with accessible home prices. Pennsylvania records 70.97%, while Mississippi (70.77%) and Louisiana (70.63%) illustrate high ownership within the South. Rounding out the list are North Dakota (70.47%), Wisconsin (70.27%), and Vermont (70.17%), followed closely by Kansas (70.03%), South Carolina (69.93%), Alabama (69.83%), Arkansas (69.73%), and Kentucky (69.63%), highlighting widespread stability across both northern and southern housing markets.
| Labels | Average Homeownership Rate (2018–2025) (%) |
|---|---|
| West Virginia | 73.93 |
| New Hampshire | 72.77 |
| Michigan | 72.37 |
| Delaware | 72.2 |
| Iowa | 72.1 |
| Maine | 71.9 |
| Minnesota | 71.53 |
| Indiana | 71.37 |
| Ohio | 71.17 |
| Pennsylvania | 70.97 |
| Mississippi | 70.77 |
| Louisiana | 70.63 |
| North Dakota | 70.47 |
| Wisconsin | 70.27 |
| Vermont | 70.17 |
| Kansas | 70.03 |
| South Carolina | 69.93 |
| Alabama | 69.83 |
| Arkansas | 69.73 |
| Kentucky | 69.63 |


