Free U.S. Top 10 States by Startup Funding Rounds (2020–2025) Chart
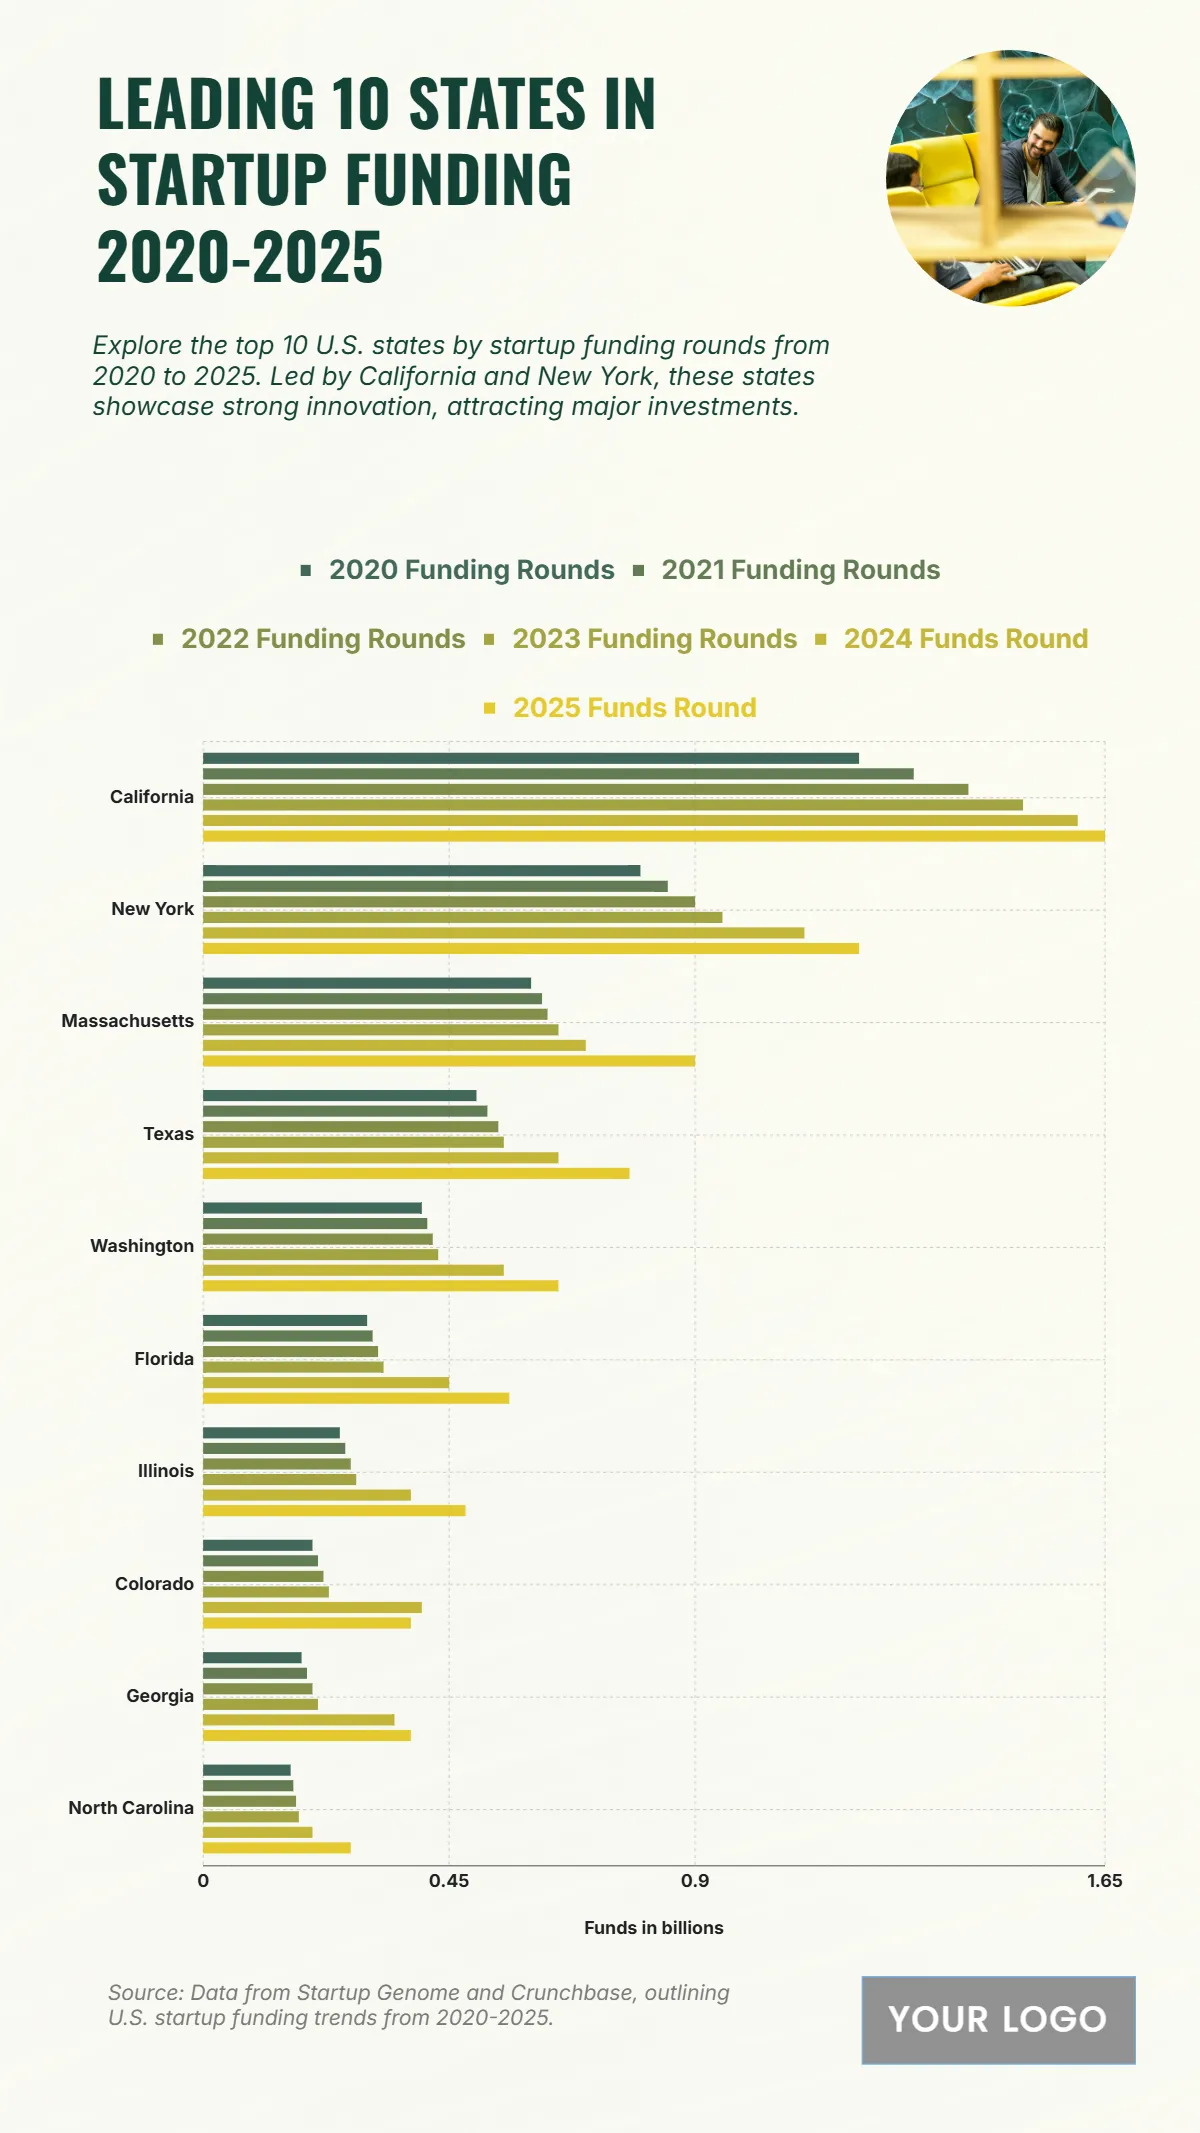
The chart presents data on startup funding rounds across the top U.S. states from 2020 to 2025, revealing consistent growth in investment activity over the years. California leads significantly, increasing from 1.2 billion USD in 2020 to 1.6 billion USD in 2024, reflecting its dominant startup ecosystem. New York follows with a steady rise from 0.8 billion USD in 2020 to 1.1 billion USD in 2024, while Massachusetts also shows growth from 0.6 to 0.7 billion USD. Texas progresses from 0.5 to 0.65 billion USD, and Washington from 0.4 to 0.55 billion USD, both exhibiting strong innovation potential. Florida reaches 0.45 billion USD, supported by emerging tech startups, while Illinois grows to 0.38 billion USD. The remaining states—Colorado (0.4), Georgia (0.35), and North Carolina (0.2)—show moderate gains. Overall, the data highlights a nationwide surge in venture activity, with technology and innovation fueling state-level economic expansion.
| Labels | 2020 Funding Rounds | 2021 Funding Rounds | 2022 Funding Rounds | 2023 Funding Rounds | 2024 Funds Round |
|---|---|---|---|---|---|
| California | 1.2 | 1.3 | 1.4 | 1.5 | 1.6 |
| New York | 0.8 | 0.85 | 0.9 | 0.95 | 1.1 |
| Massachusetts | 0.6 | 0.62 | 0.63 | 0.65 | 0.7 |
| Texas | 0.5 | 0.52 | 0.54 | 0.55 | 0.65 |
| Washington | 0.4 | 0.41 | 0.42 | 0.43 | 0.55 |
| Florida | 0.3 | 0.31 | 0.32 | 0.33 | 0.45 |
| Illinois | 0.25 | 0.26 | 0.27 | 0.28 | 0.38 |
| Colorado | 0.2 | 0.21 | 0.22 | 0.23 | 0.4 |
| Georgia | 0.18 | 0.19 | 0.2 | 0.21 | 0.35 |
| North Carolina | 0.16 | 0.165 | 0.17 | 0.175 | 0.2 |


