Free Top 20 U.S. States by Housing Affordability (2020–2025) Chart
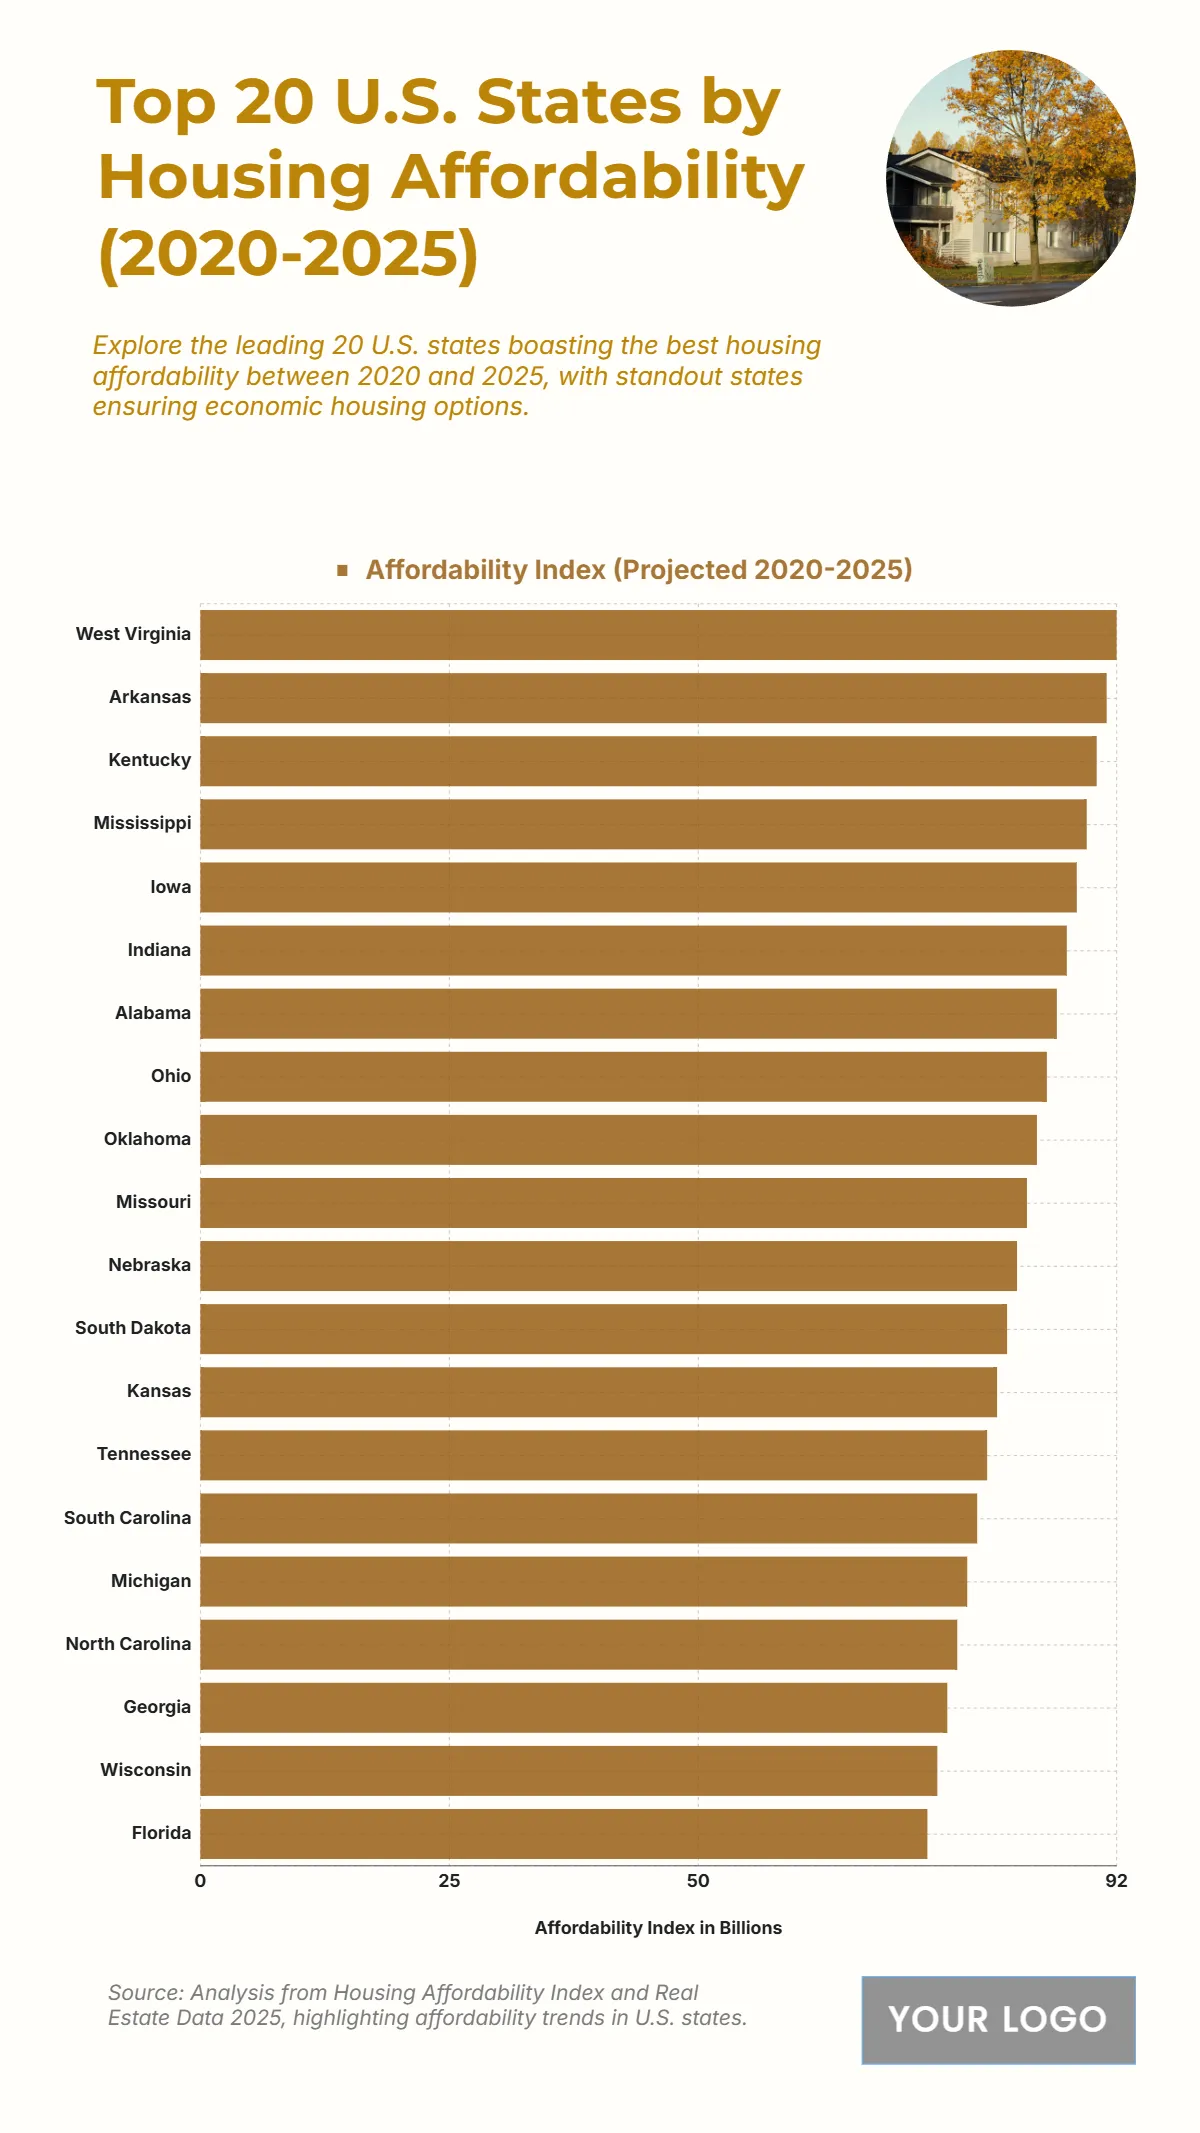
The chart presents data on the housing affordability index across 20 U.S. states projected between 2020 and 2025, showing regions where homes are most affordable. West Virginia leads with the highest affordability index at 92, indicating the most favorable housing costs relative to income. Arkansas follows closely at 91, and Kentucky ranks third at 90, emphasizing strong affordability in the South and Midwest. Mississippi records 89, while Iowa and Indiana trail slightly at 88 and 87, respectively. Alabama (86), Ohio (85), and Oklahoma (84) highlight additional Midwest and Southern affordability strengths. The index continues to decline modestly among states like Missouri (83), Nebraska (82), and South Dakota (81). Meanwhile, Florida ranks lowest at 73, reflecting higher home prices relative to income. Overall, the data underscores that central and southern states consistently offer greater affordability, while coastal regions face higher cost-of-living pressures.
| Labels | Affordability Index (Projected 2020–2025) |
|---|---|
| West Virginia | 92 |
| Arkansas | 91 |
| Kentucky | 90 |
| Mississippi | 89 |
| Iowa | 88 |
| Indiana | 87 |
| Alabama | 86 |
| Ohio | 85 |
| Oklahoma | 84 |
| Missouri | 83 |
| Nebraska | 82 |
| South Dakota | 81 |
| Kansas | 80 |
| Tennessee | 79 |
| South Carolina | 78 |
| Michigan | 77 |
| North Carolina | 76 |
| Georgia | 75 |
| Wisconsin | 74 |
| Florida | 73 |


