Free U.S. Top 10 States by Food Price Inflation (2018–2025) Chart
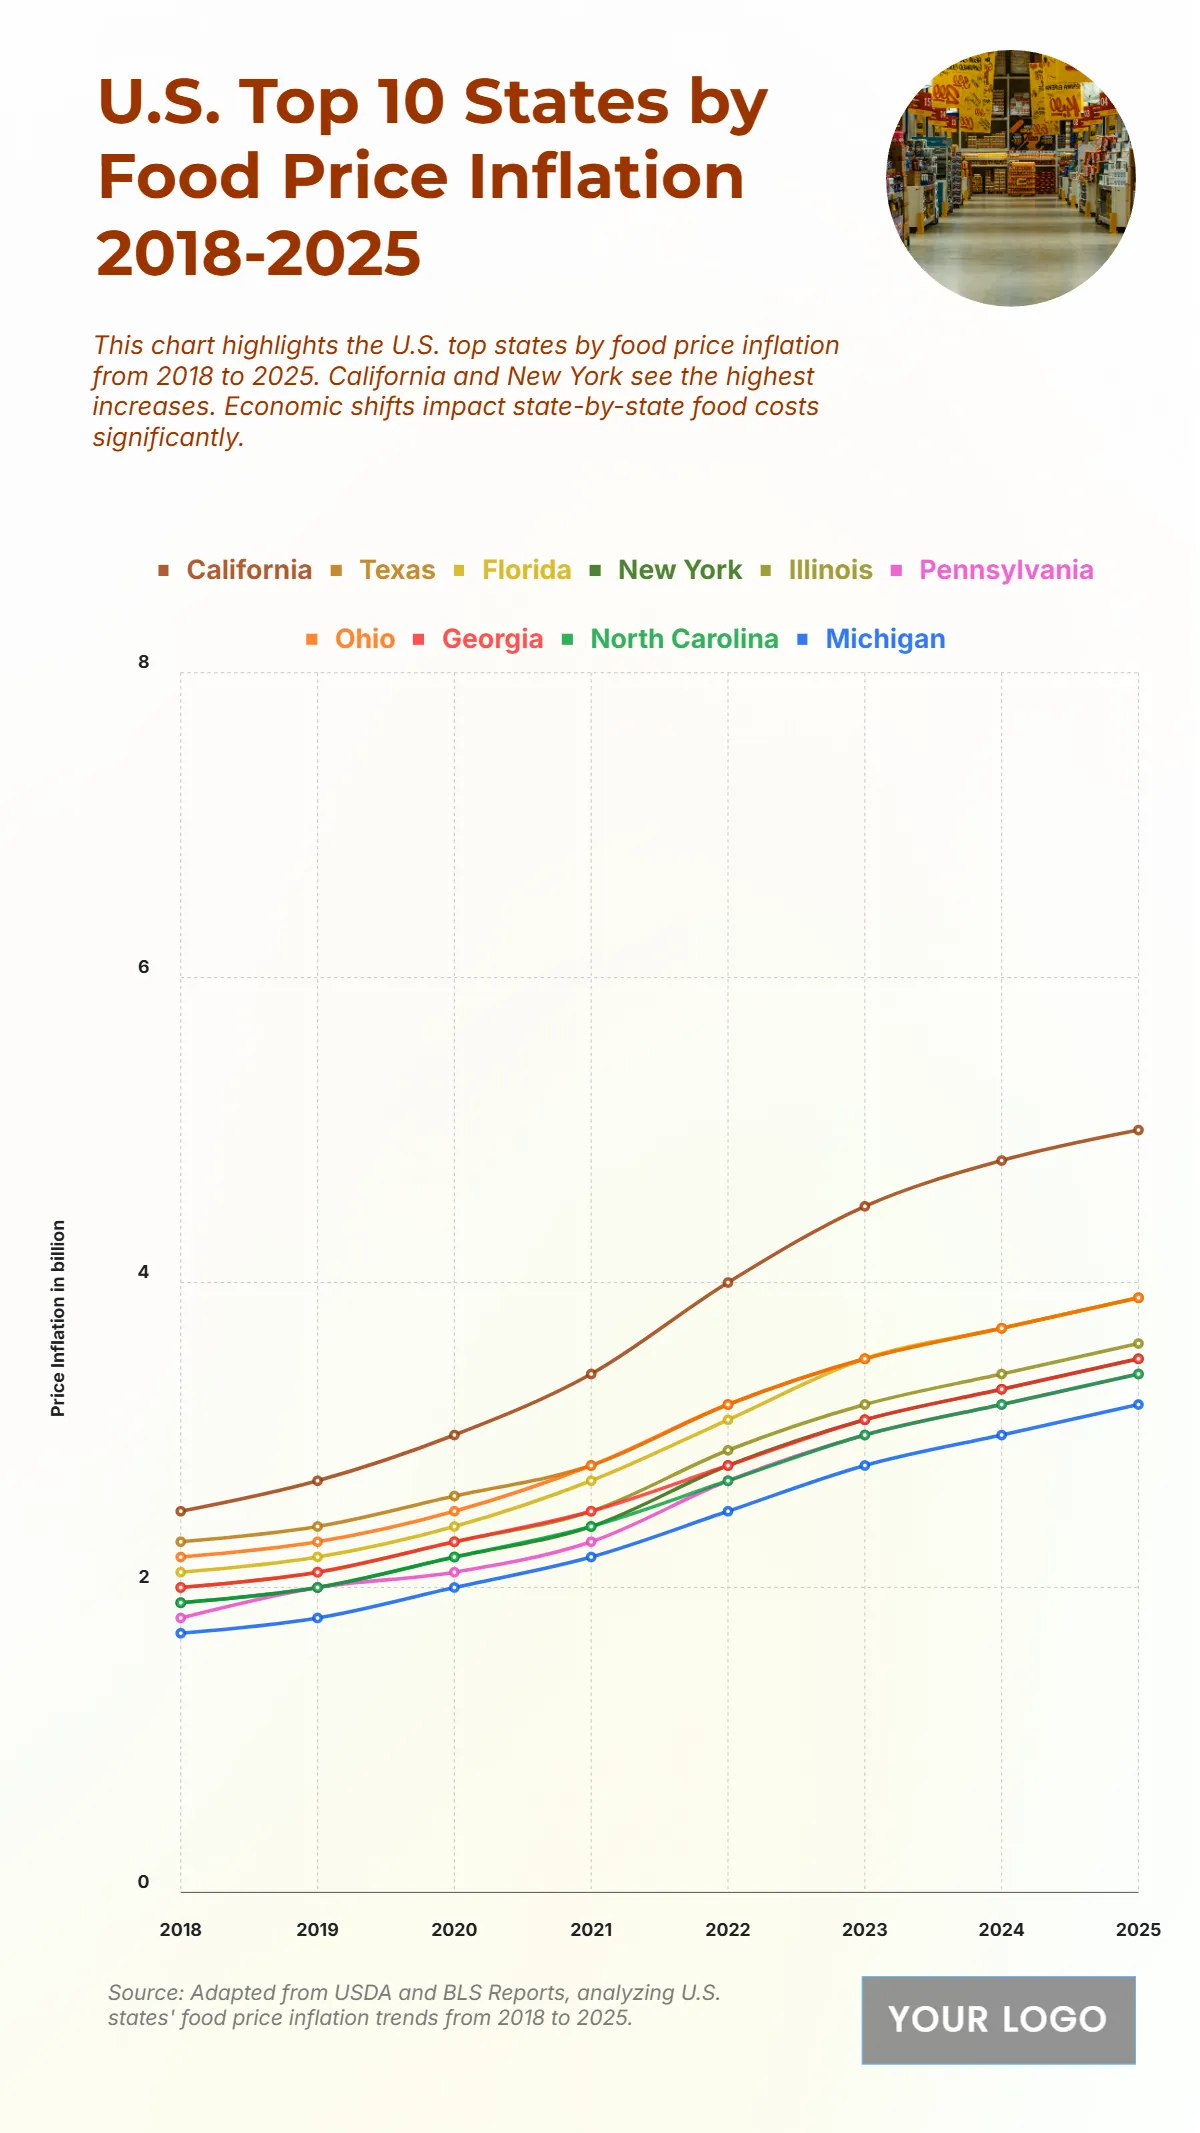
The chart illustrates the steady rise in food price inflation across the top U.S. states from 2018 to 2025, reflecting growing economic pressures and supply chain fluctuations. California records the steepest increase, rising from 2.5% in 2018 to 5% in 2025, indicating persistent cost escalation. Texas follows with an increase from 2.3% to 3.9%, while Florida and New York both climb from around 2.1% and 1.9% in 2018 to 3.9% and 3.5% by 2025, respectively. Illinois shows a gradual rise from 2% to 3.6%, and Pennsylvania moves from 1.8% to 3.4%. Meanwhile, Ohio exhibits one of the sharpest trends, growing from 2.2% in 2018 to 3.9% in 2025, while Georgia advances from 2% to 3.5%. The overall data highlights how every state experiences steady year-over-year inflation growth, with California leading the surge due to higher living and production costs.
| Labels | California | Texas | Florida | New York | Illinois | Pennsylvania | Ohio | Georgia |
|---|---|---|---|---|---|---|---|---|
| 2018 | 2.5 | 2.3 | 2.1 | 1.9 | 2 | 1.8 | 2.2 | 2 |
| 2019 | 2.7 | 2.4 | 2.2 | 2 | 2.1 | 2 | 2.3 | 2.1 |
| 2020 | 3 | 2.6 | 2.4 | 2.2 | 2.3 | 2.1 | 2.5 | 2.3 |
| 2021 | 3.4 | 2.8 | 2.7 | 2.4 | 2.5 | 2.3 | 2.8 | 2.5 |
| 2022 | 4 | 3.2 | 3.1 | 2.8 | 2.9 | 2.7 | 3.2 | 2.8 |
| 2023 | 4.5 | 3.5 | 3.5 | 3.1 | 3.2 | 3 | 3.5 | 3.1 |
| 2024 | 4.8 | 3.7 | 3.7 | 3.3 | 3.4 | 3.2 | 3.7 | 3.3 |
| 2025 | 5 | 3.9 | 3.9 | 3.5 | 3.6 | 3.4 | 3.9 | 3.5 |


