Free Top 20 U.S. States by Median Household Income (2020–2025) Chart
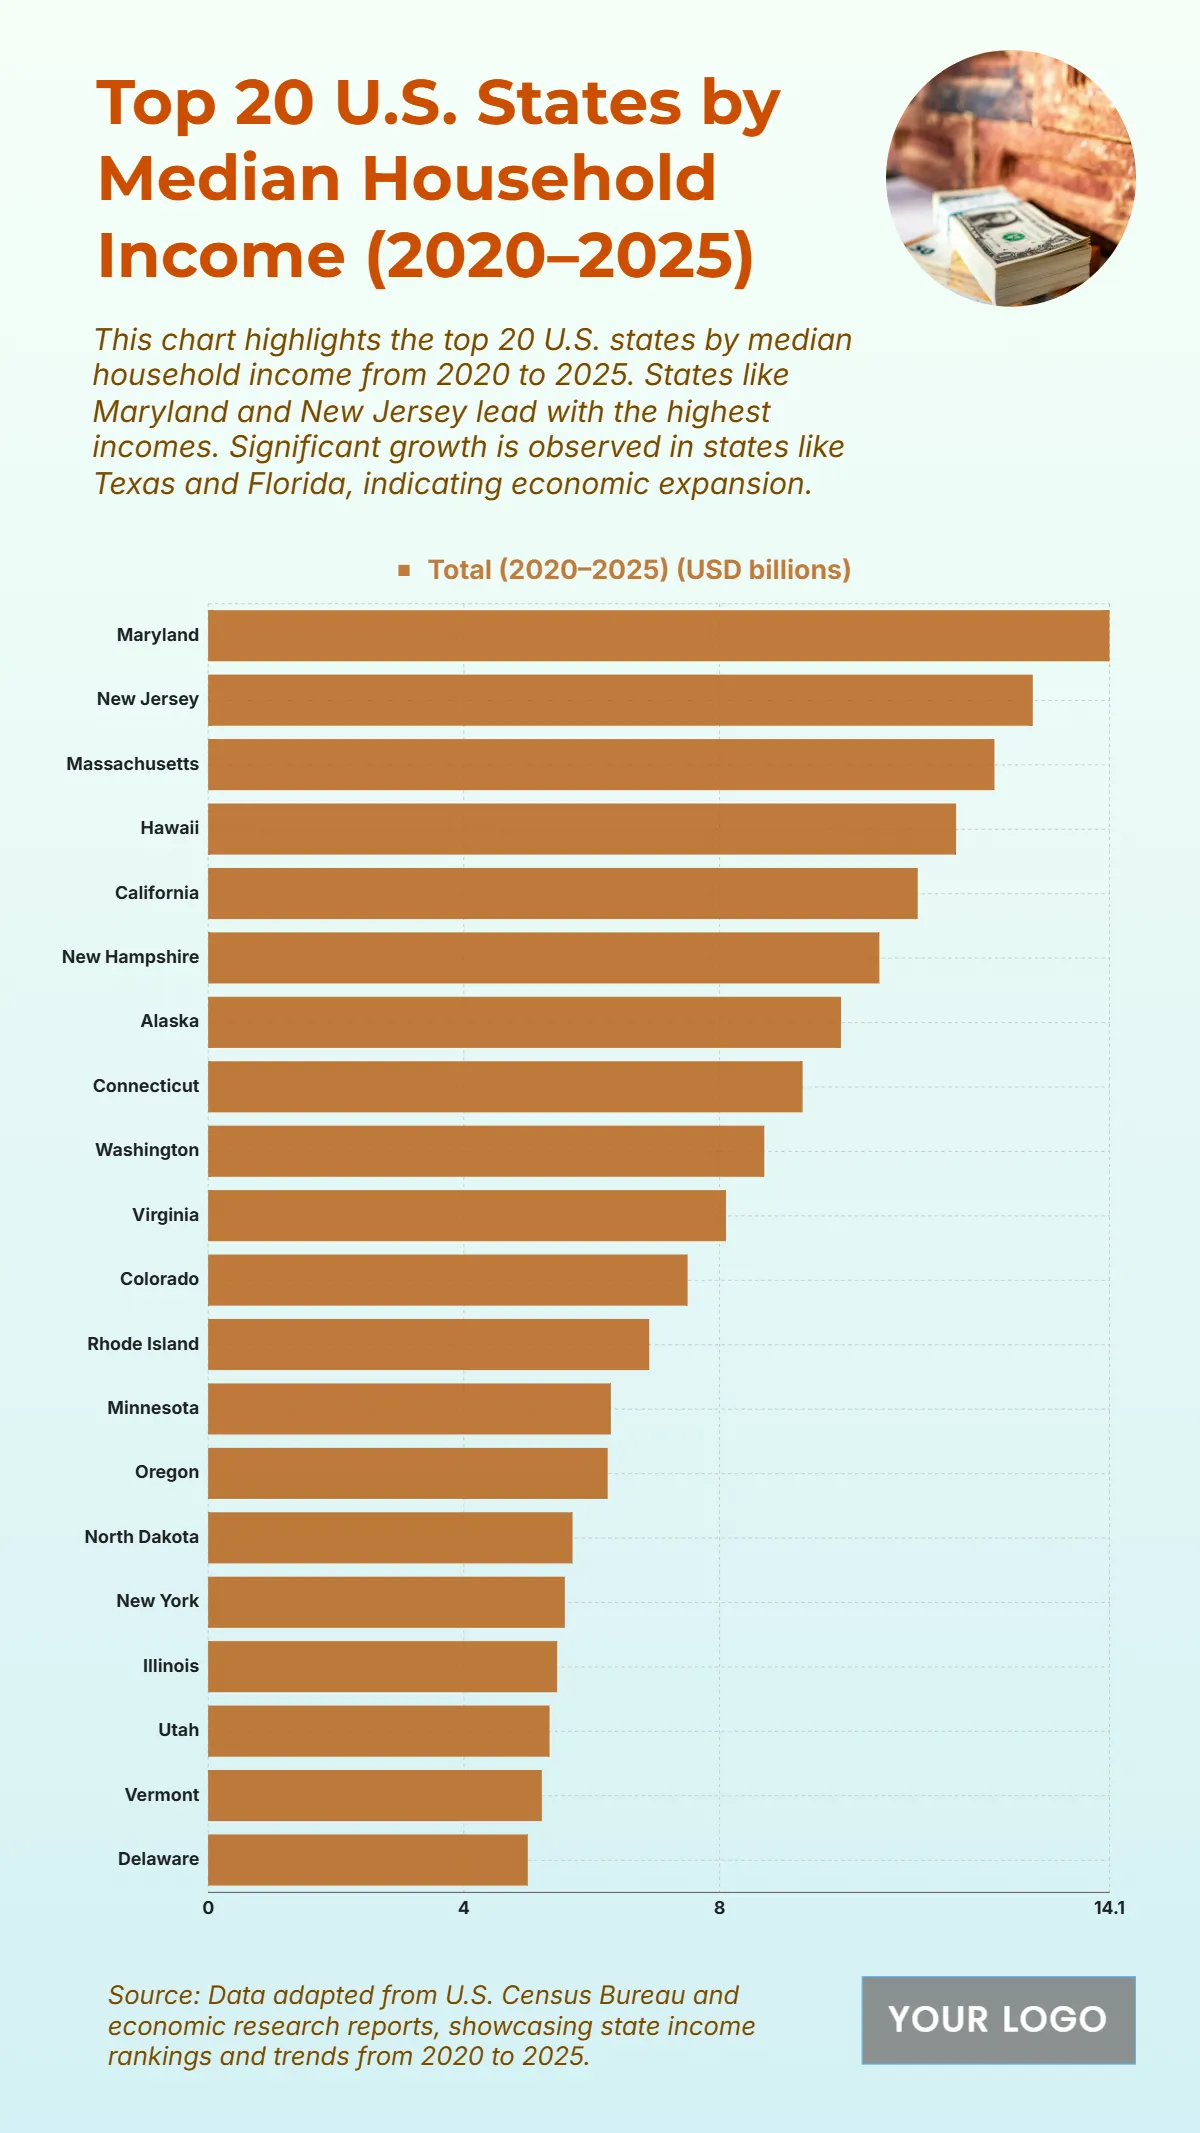
The chart highlights the distribution of median household income across U.S. states from 2020 to 2025, showing notable economic disparities and leading performers. Maryland ranks the highest with a total median household income of $14.1 billion, reflecting strong economic activity. New Jersey follows closely at $12.9 billion, while Massachusetts records $12.3 billion, indicating consistent high-income levels. Hawaii reaches $11.7 billion, and California follows with $11.1 billion, driven by population and economic scale. Mid-level states like New Hampshire ($10.5 billion), Alaska ($9.9 billion), and Connecticut ($9.3 billion) also reflect robust earnings. Washington and Virginia stand at $8.7 billion and $8.1 billion, respectively. Lower in the rankings, states like Rhode Island ($6.9 billion), Minnesota ($6.3 billion), and Oregon ($6.25 billion) still maintain solid income levels. Delaware closes the list with $5 billion, highlighting the variation in household earnings nationwide.
| Labels | Total (2020–2025) (USD billions) |
|---|---|
| Maryland | 14.1 |
| New Jersey | 12.9 |
| Massachusetts | 12.3 |
| Hawaii | 11.7 |
| California | 11.1 |
| New Hampshire | 10.5 |
| Alaska | 9.9 |
| Connecticut | 9.3 |
| Washington | 8.7 |
| Virginia | 8.1 |
| Colorado | 7.5 |
| Rhode Island | 6.9 |
| Minnesota | 6.3 |
| Oregon | 6.25 |
| North Dakota | 5.7 |
| New York | 5.58 |
| Illinois | 5.46 |
| Utah | 5.34 |
| Vermont | 5.22 |
| Delaware | 5.0 |


