Free Top 20 U.S. States by Retail Sales per Capita (2020–2025)
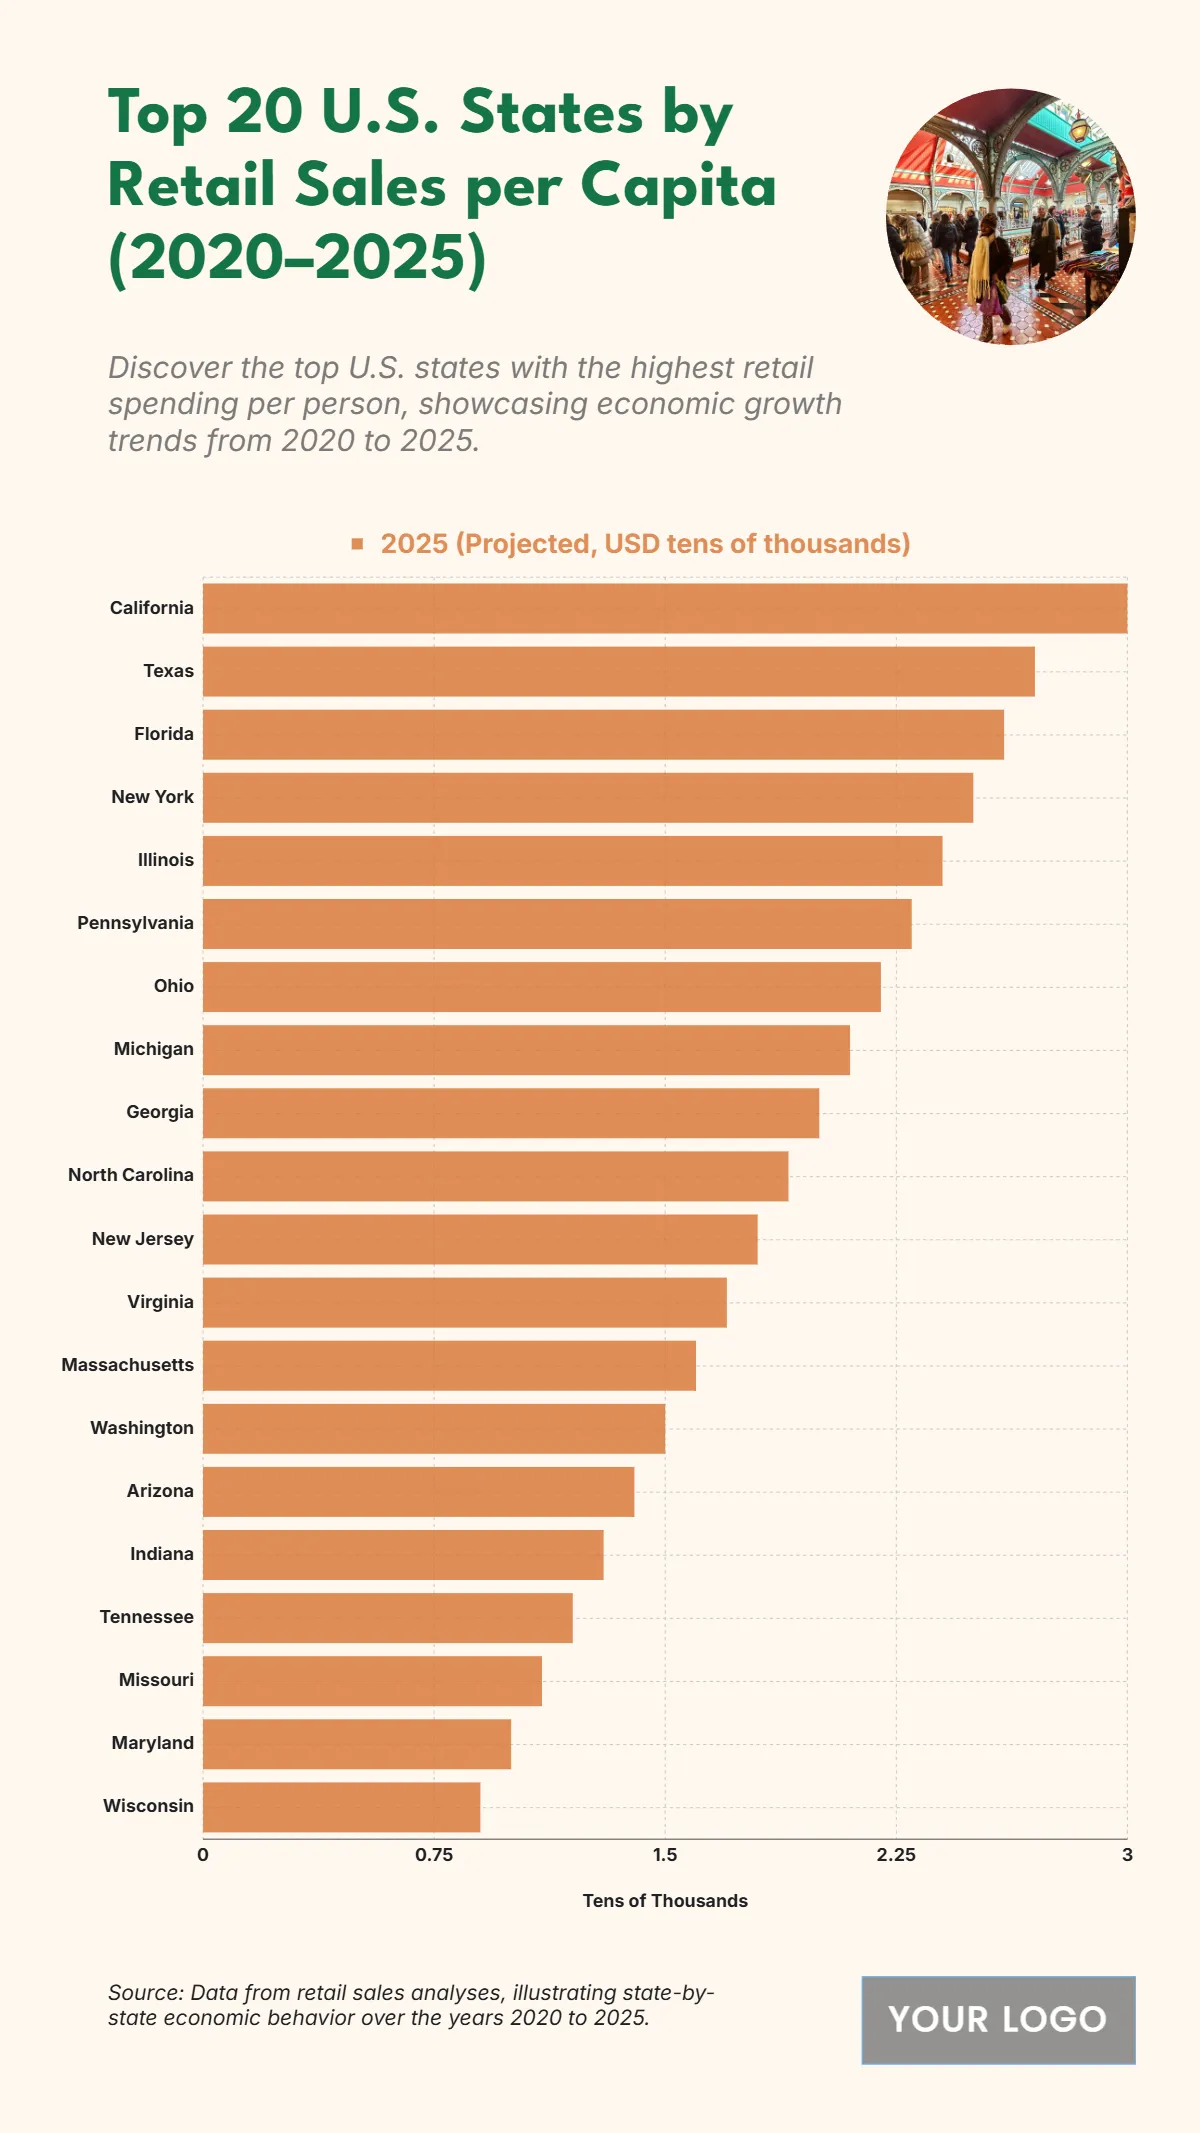
The chart highlights the projected per capita retail sales across the top 20 U.S. states for 2025, reflecting strong economic performance and consumer spending trends. California leads with an estimated 3.0 USD tens of thousands, followed by Texas with 2.7, and Florida at 2.6, showcasing the robust retail markets in these high-population and high-income states. New York ranks fourth with 2.5, while Illinois and Pennsylvania follow at 2.4 and 2.3, respectively. Midwestern states like Ohio (2.2) and Michigan (2.1) demonstrate steady retail activity, while southern states such as Georgia (2.0) and North Carolina (1.9) also exhibit consistent consumer spending. The remaining states, including New Jersey (1.8), Virginia (1.7), and Massachusetts (1.6), maintain moderate growth, while Wisconsin rounds out the list with 0.9. Overall, the data shows that consumer purchasing power and retail expansion are concentrated in economically diverse yet dynamic states driving the nation’s spending growth.
| Labels | 2025 (Projected, USD tens of thousands) |
|---|---|
| California | 3.0 |
| Texas | 2.7 |
| Florida | 2.6 |
| New York | 2.5 |
| Illinois | 2.4 |
| Pennsylvania | 2.3 |
| Ohio | 2.2 |
| Michigan | 2.1 |
| Georgia | 2.0 |
| North Carolina | 1.9 |
| New Jersey | 1.8 |
| Virginia | 1.7 |
| Massachusetts | 1.6 |
| Washington | 1.5 |
| Arizona | 1.4 |
| Indiana | 1.3 |
| Tennessee | 1.2 |
| Missouri | 1.1 |
| Maryland | 1.0 |
| Wisconsin | 0.9 |


