Free Top 20 U.S. States by Labor Force Participation Rate (2018–2025) Chart
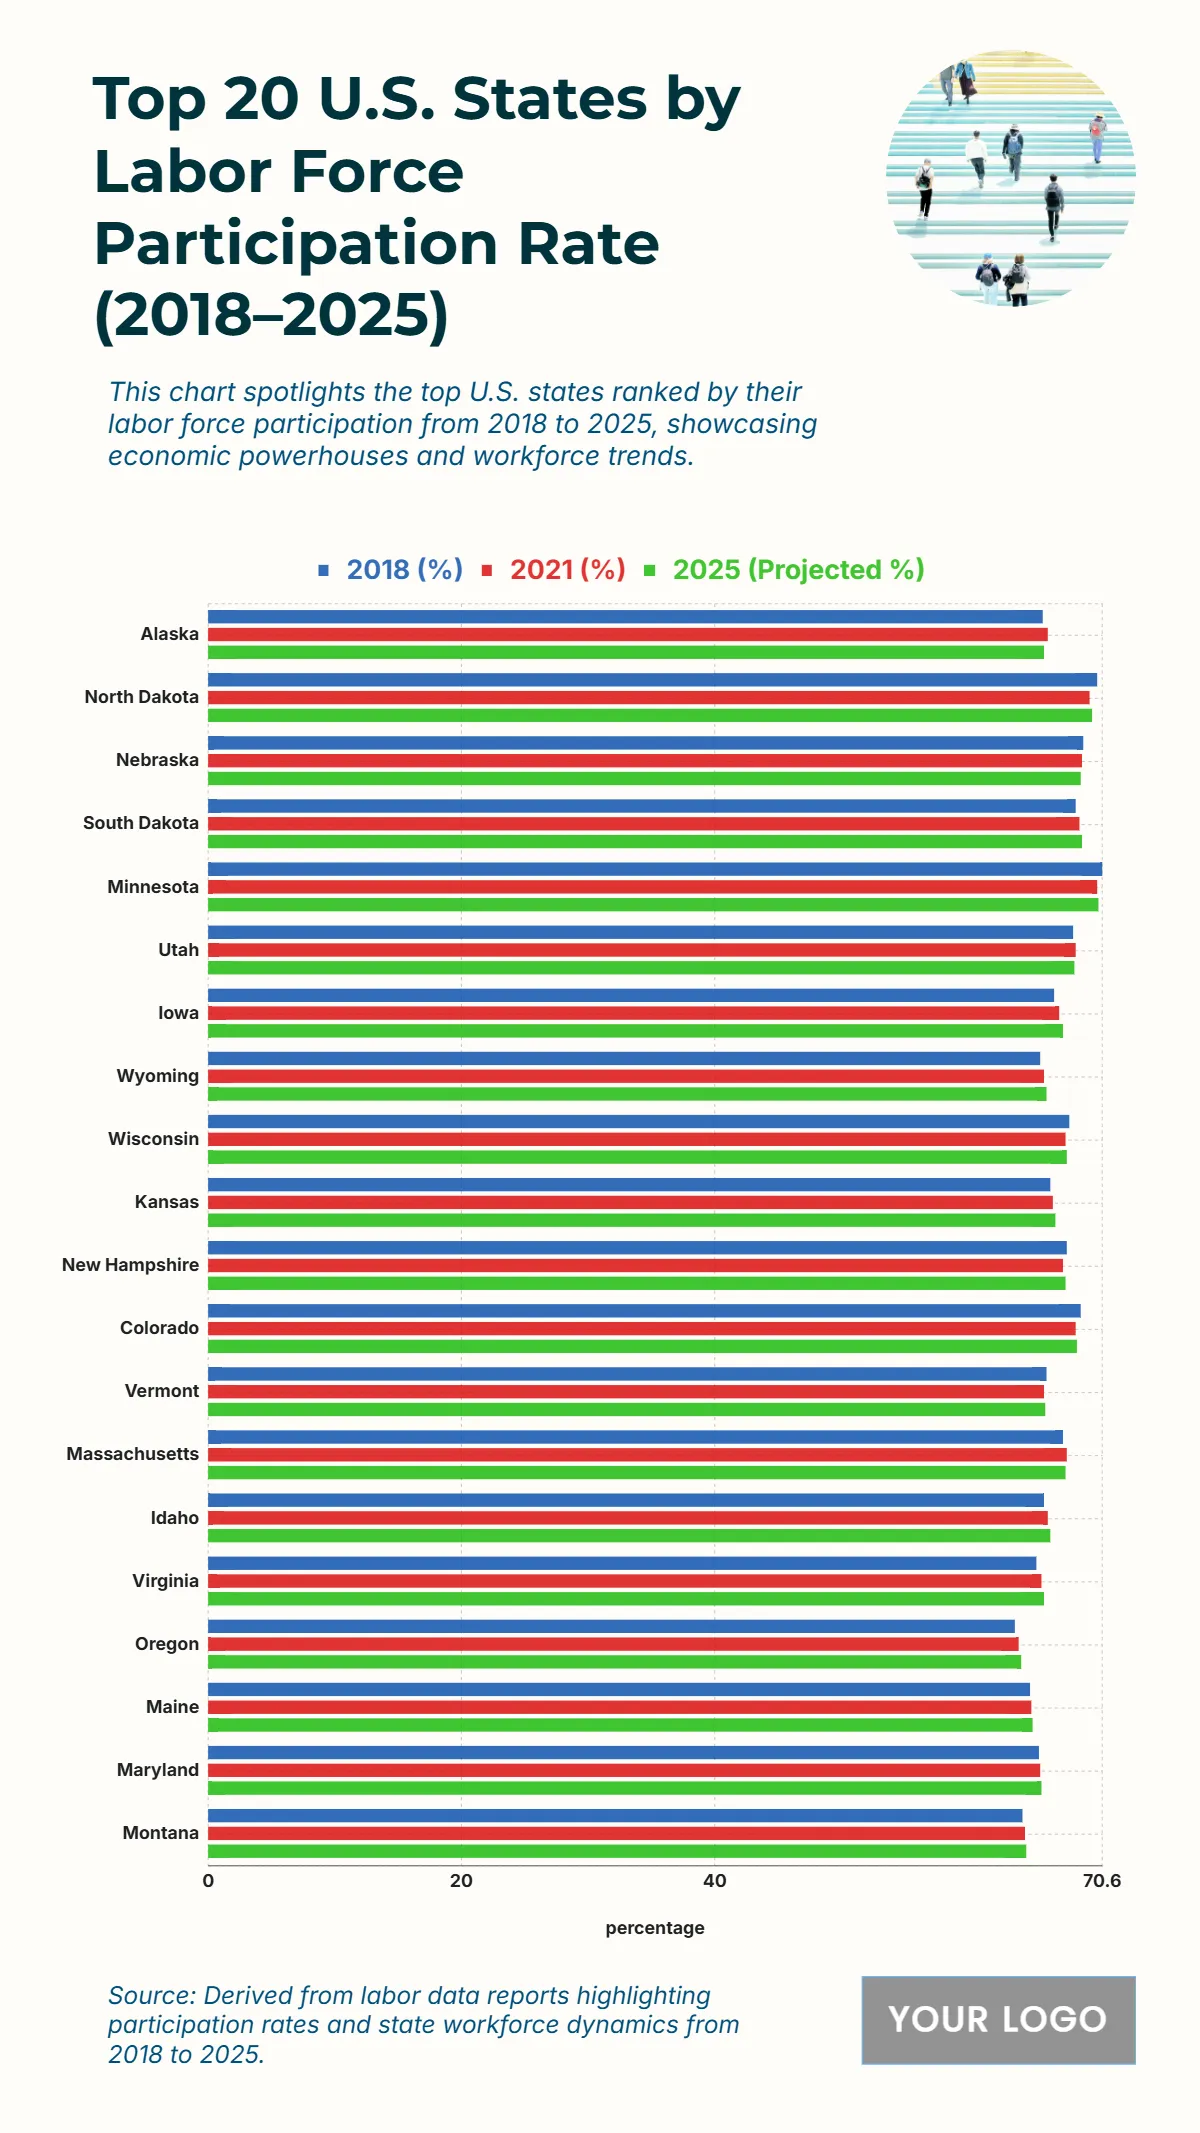
The chart illustrates labor force participation trends among the top 20 U.S. states from 2018 to 2025, showing consistent workforce engagement across the board. North Dakota leads throughout the period, slightly decreasing from 70.2% in 2018 to 69.8% in 2025. Minnesota remains a strong performer, moving from 70.6% to 70.3%, maintaining one of the highest participation rates nationally. Nebraska shows stability at 69.1% in 2018 and 68.9% in 2025, while South Dakota rises marginally from 68.5% to 69%. States like Wisconsin, Kansas, and Iowa show steady participation with rates ranging between 66–68% over the years. Alaska experiences slight growth, moving from 65.9% to 66%, while Virginia increases from 65.4% to 66%. Lower but improving figures are observed in Oregon, climbing from 63.7% to 64.2%, and Idaho from 66% to 66.5%. This data underscores stable workforce engagement with minor fluctuations across leading states.
| Labels | 2018 (%) | 2021 (%) | 2025 (Projected %) |
|---|---|---|---|
| Alaska | 65.9 | 66.3 | 66 |
| North Dakota | 70.2 | 69.6 | 69.8 |
| Nebraska | 69.1 | 69 | 68.9 |
| South Dakota | 68.5 | 68.8 | 69 |
| Minnesota | 70.6 | 70.2 | 70.3 |
| Utah | 68.3 | 68.5 | 68.4 |
| Iowa | 66.8 | 67.2 | 67.5 |
| Wyoming | 65.7 | 66 | 66.2 |
| Wisconsin | 68 | 67.7 | 67.8 |
| Kansas | 66.5 | 66.7 | 66.9 |
| New Hampshire | 67.8 | 67.5 | 67.7 |
| Colorado | 68.9 | 68.5 | 68.6 |
| Vermont | 66.2 | 66 | 66.1 |
| Massachusetts | 67.5 | 67.8 | 67.7 |
| Idaho | 66 | 66.3 | 66.5 |
| Virginia | 65.4 | 65.8 | 66 |
| Oregon | 63.7 | 64 | 64.2 |


