Free U.S. Top 10 States by Healthcare Sector Revenue (2018–2025) Charts
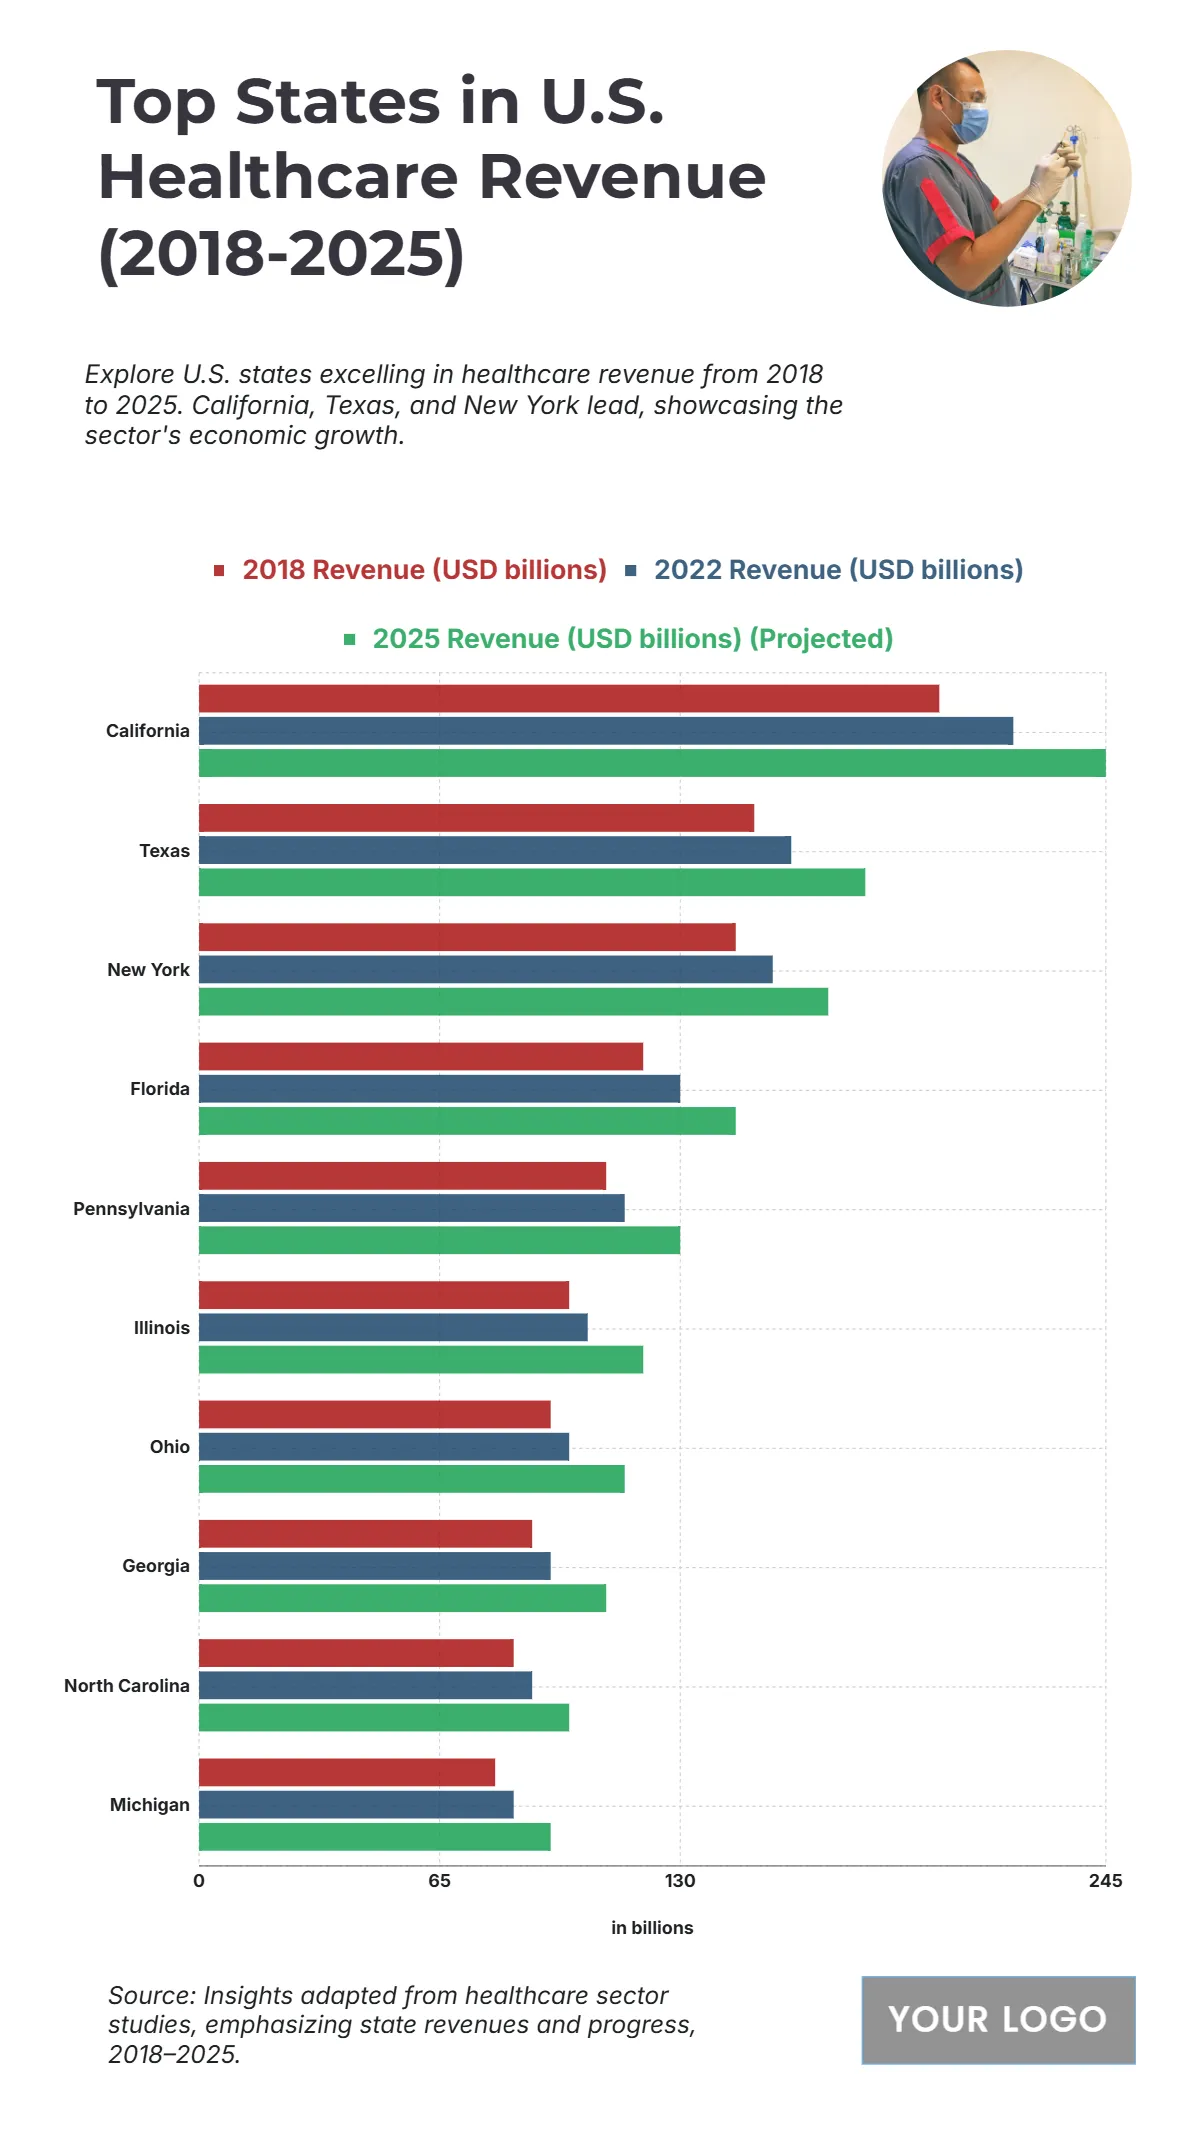
The chart shows the upward trajectory of healthcare revenue across key U.S. states between 2018 and 2025, reflecting growing investment and expansion in the healthcare sector. California leads with revenue increasing from $200 billion in 2018 to $220 billion in 2022 and a projected $245 billion in 2025, emphasizing its dominance in the industry. Texas follows, rising from $150 billion to $160 billion, with an expected $180 billion by 2025. New York climbs steadily from $145 billion to $170 billion, while Florida grows from $120 billion to $145 billion. Pennsylvania moves from $110 billion to $130 billion, showing consistent progress. Mid-range states like Illinois, Ohio, and Georgia are projected to generate $120 billion, $115 billion, and $110 billion respectively by 2025. North Carolina and Michigan, while lower, still exhibit strong growth reaching $100 billion and $95 billion, underlining the broad national trend of healthcare revenue expansion.
| Labels | 2018 Revenue (USD billions) | 2022 Revenue (USD billions) | 2025 Revenue (USD billions) (Projected) |
|---|---|---|---|
| California | 200 | 220 | 245 |
| Texas | 150 | 160 | 180 |
| New York | 145 | 155 | 170 |
| Florida | 120 | 130 | 145 |
| Pennsylvania | 110 | 115 | 130 |
| Illinois | 100 | 105 | 120 |
| Ohio | 95 | 100 | 115 |
| Georgia | 90 | 95 | 110 |
| North Carolina | 85 | 90 | 100 |
| Michigan | 80 | 85 | 95 |


