Free Top 20 States by Agricultural Output Value (2020–2025) Charts
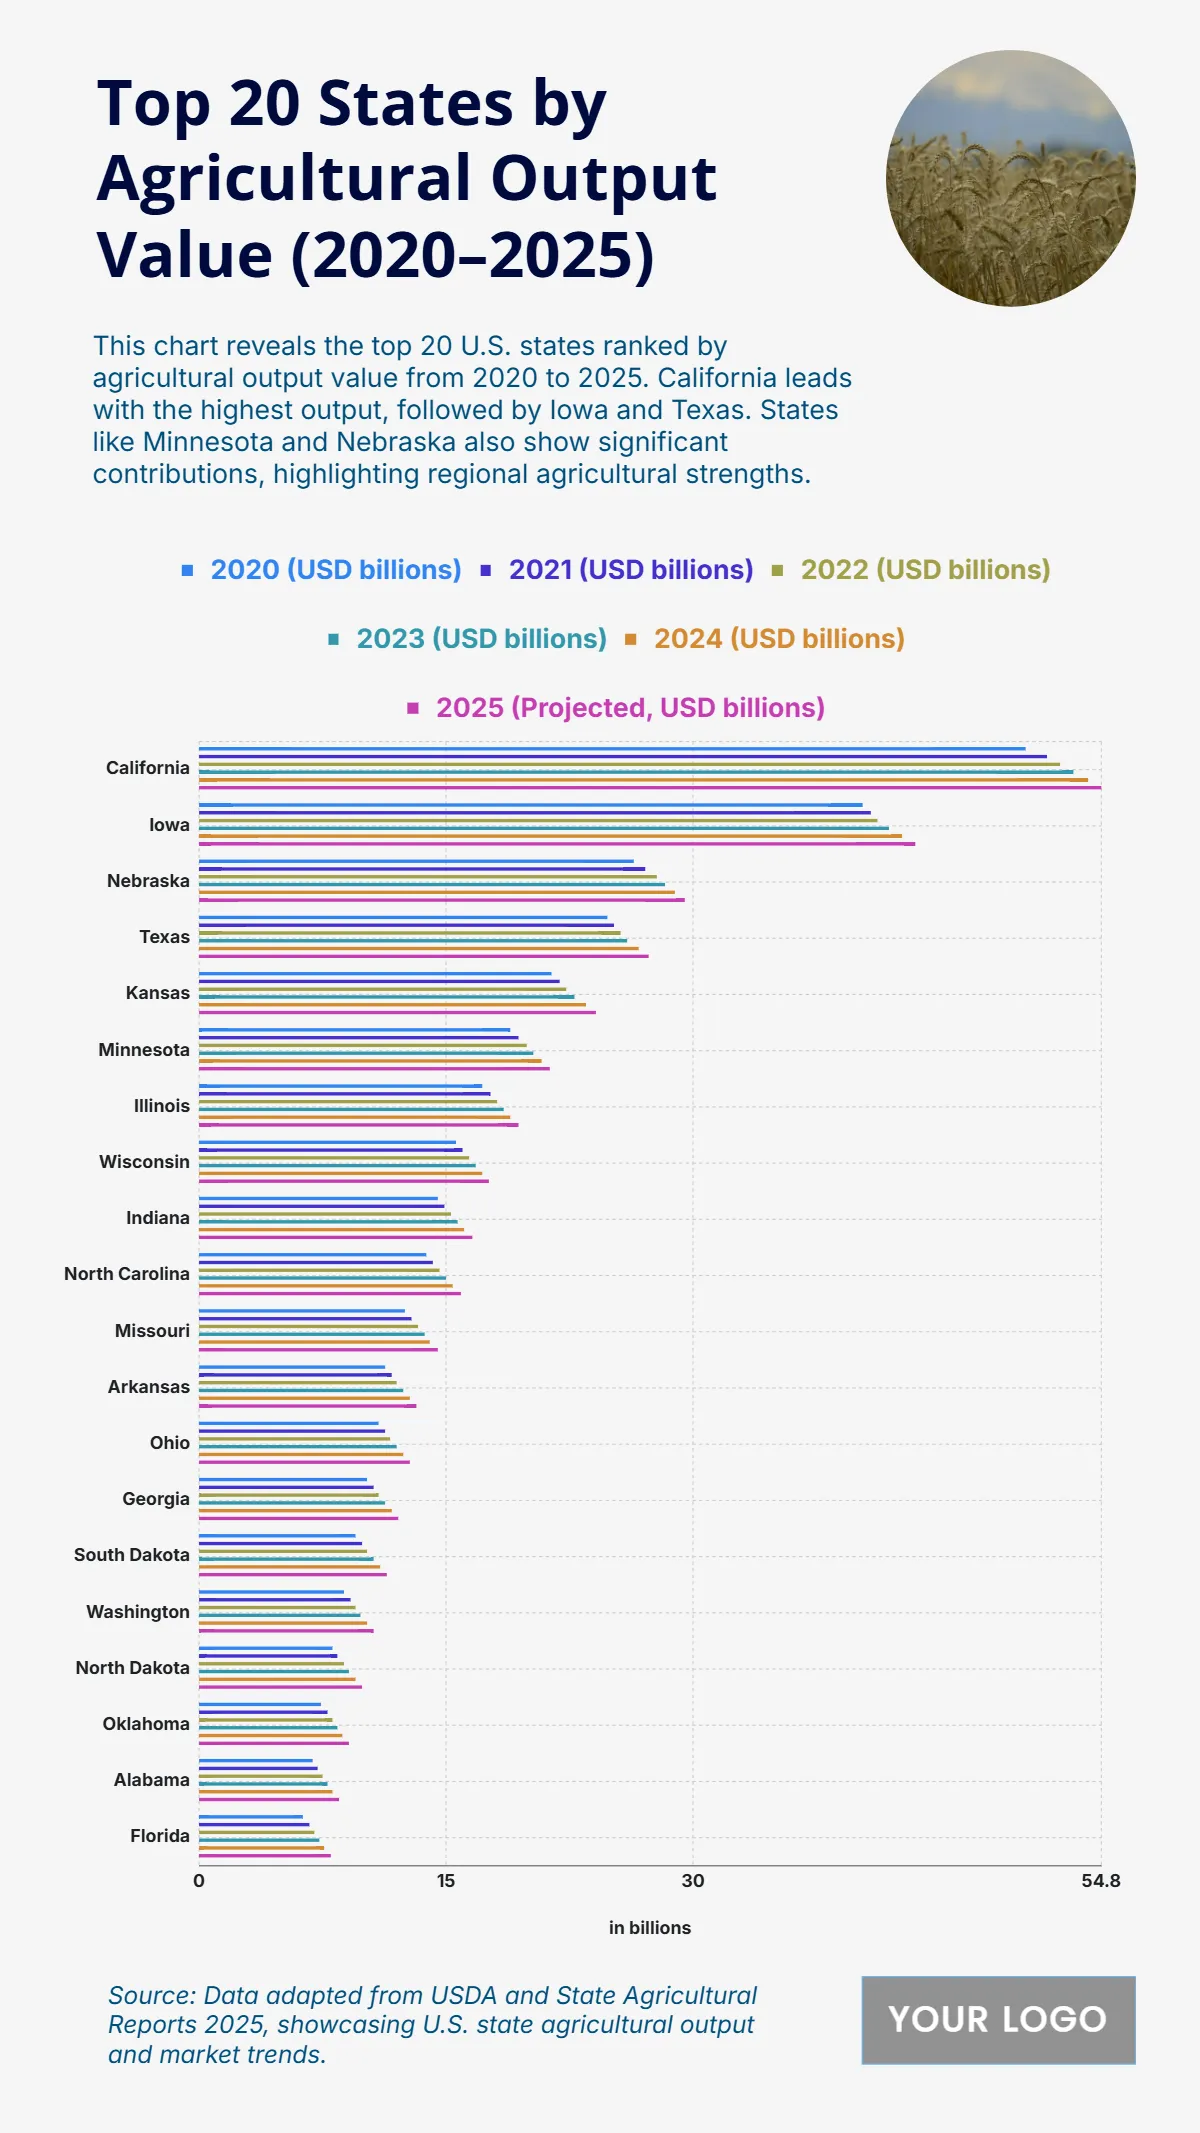
The chart highlights the steady growth of agricultural output value among the top 20 U.S. states from 2020 to 2025, led by California, which rises from $50.2 billion in 2020 to $54 billion in 2024. Iowa follows as the second-highest contributor, increasing from $40.3 billion to $42.7 billion, while Nebraska grows from $26.4 billion to $28.9 billion. Texas also shows consistent gains, climbing from $24.8 billion to $26.7 billion, with Kansas reaching $23.5 billion by 2024. Mid-range contributors like Minnesota, Illinois, and Wisconsin record values between $20.8 billion and $17.2 billion. Other notable states include Indiana with $16.1 billion, North Carolina with $15.4 billion, and Missouri with $14 billion. The lower tier states, such as Georgia, South Dakota, and North Dakota, still demonstrate upward trends, reflecting the sector’s broad-based growth and agricultural strength across different regions.
| Labels | 2020 (USD billions) | 2021 (USD billions) | 2022 (USD billions) | 2023 (USD billions) | 2024 (USD billions) |
|---|---|---|---|---|---|
| California | 50.2 | 51.5 | 52.3 | 53.1 | 54 |
| Iowa | 40.3 | 40.8 | 41.2 | 41.9 | 42.7 |
| Nebraska | 26.4 | 27.1 | 27.8 | 28.3 | 28.9 |
| Texas | 24.8 | 25.2 | 25.6 | 26 | 26.7 |
| Kansas | 21.4 | 21.9 | 22.3 | 22.8 | 23.5 |
| Minnesota | 18.9 | 19.4 | 19.9 | 20.3 | 20.8 |
| Illinois | 17.2 | 17.7 | 18.1 | 18.5 | 18.9 |
| Wisconsin | 15.6 | 16 | 16.4 | 16.8 | 17.2 |
| Indiana | 14.5 | 14.9 | 15.3 | 15.7 | 16.1 |
| North Carolina | 13.8 | 14.2 | 14.6 | 15 | 15.4 |
| Missouri | 12.5 | 12.9 | 13.3 | 13.7 | 14 |
| Arkansas | 11.3 | 11.7 | 12 | 12.4 | 12.8 |
| Ohio | 10.9 | 11.3 | 11.6 | 12 | 12.4 |
| Georgia | 10.2 | 10.6 | 10.9 | 11.3 | 11.7 |
| South Dakota | 9.5 | 9.9 | 10.2 | 10.6 | 11 |
| Washington | 8.8 | 9.2 | 9.5 | 9.8 | 10.2 |
| North Dakota | 8.1 | 8.4 | 8.8 | 9.1 | 9.5 |


