Free Top 20 U.S. States by Average Household Expenditures (2018–2025) Chart
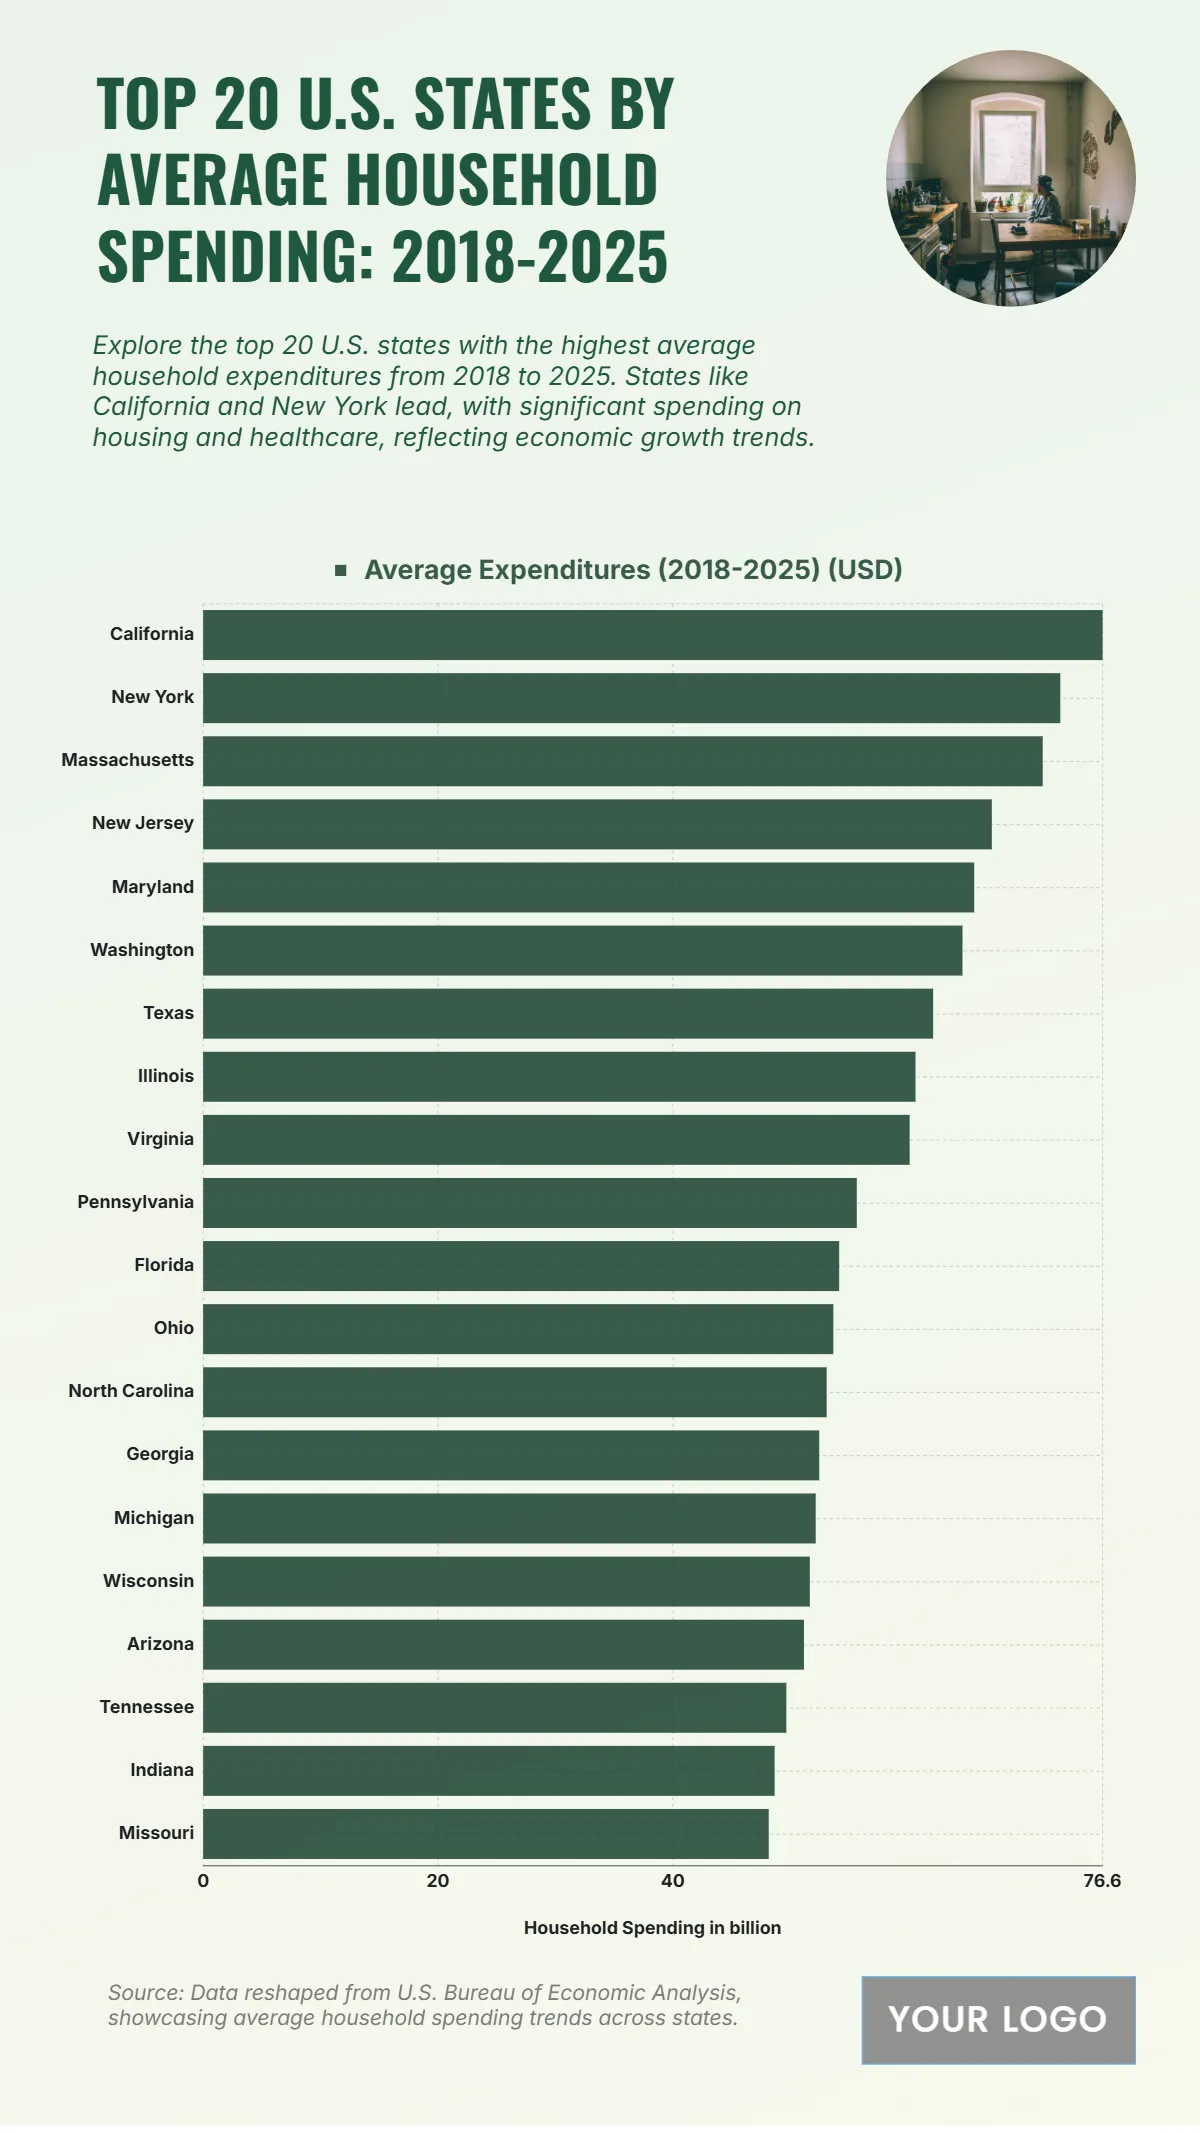
The chart presents the top 20 U.S. states with the highest average household expenditures from 2018 to 2025, reflecting broader economic growth and spending behavior. California tops the list with $76.6 billion, followed by New York at $73 billion, and Massachusetts at $71.5 billion, highlighting strong economic activity in these states. New Jersey records $67.17 billion, while Maryland and Washington reach $65.67 billion and $64.67 billion respectively. Mid-tier states like Texas, Illinois, and Virginia show spending between $60–62 billion, indicating steady household consumption. Pennsylvania follows at $55.67 billion, while Florida and Ohio maintain solid figures of $54.17 billion and $53.67 billion. Other states such as North Carolina, Georgia, Michigan, and Wisconsin range between $51–53 billion. The lower end includes Arizona, Tennessee, Indiana, and Missouri, with Missouri at $48.17 billion, showing a clear spending gap between the top and bottom states.
| Labels | Average Expenditures (2018–2025) (USD) |
|---|---|
| California | 76.6 |
| New York | 73 |
| Massachusetts | 71.5 |
| New Jersey | 67.166 |
| Maryland | 65.666 |
| Washington | 64.666 |
| Texas | 62.166 |
| Illinois | 60.666 |
| Virginia | 60.166 |
| Pennsylvania | 55.666 |
| Florida | 54.166 |
| Ohio | 53.666 |
| North Carolina | 53.1 |
| Georgia | 52.466 |
| Michigan | 52.166 |
| Wisconsin | 51.666 |
| Arizona | 51.166 |
| Tennessee | 49.666 |
| Indiana | 48.666 |
| Missouri | 48.166 |


