Free U.S. Top 10 States by Logistics and Supply Chain Employment (2018–2025) Chart
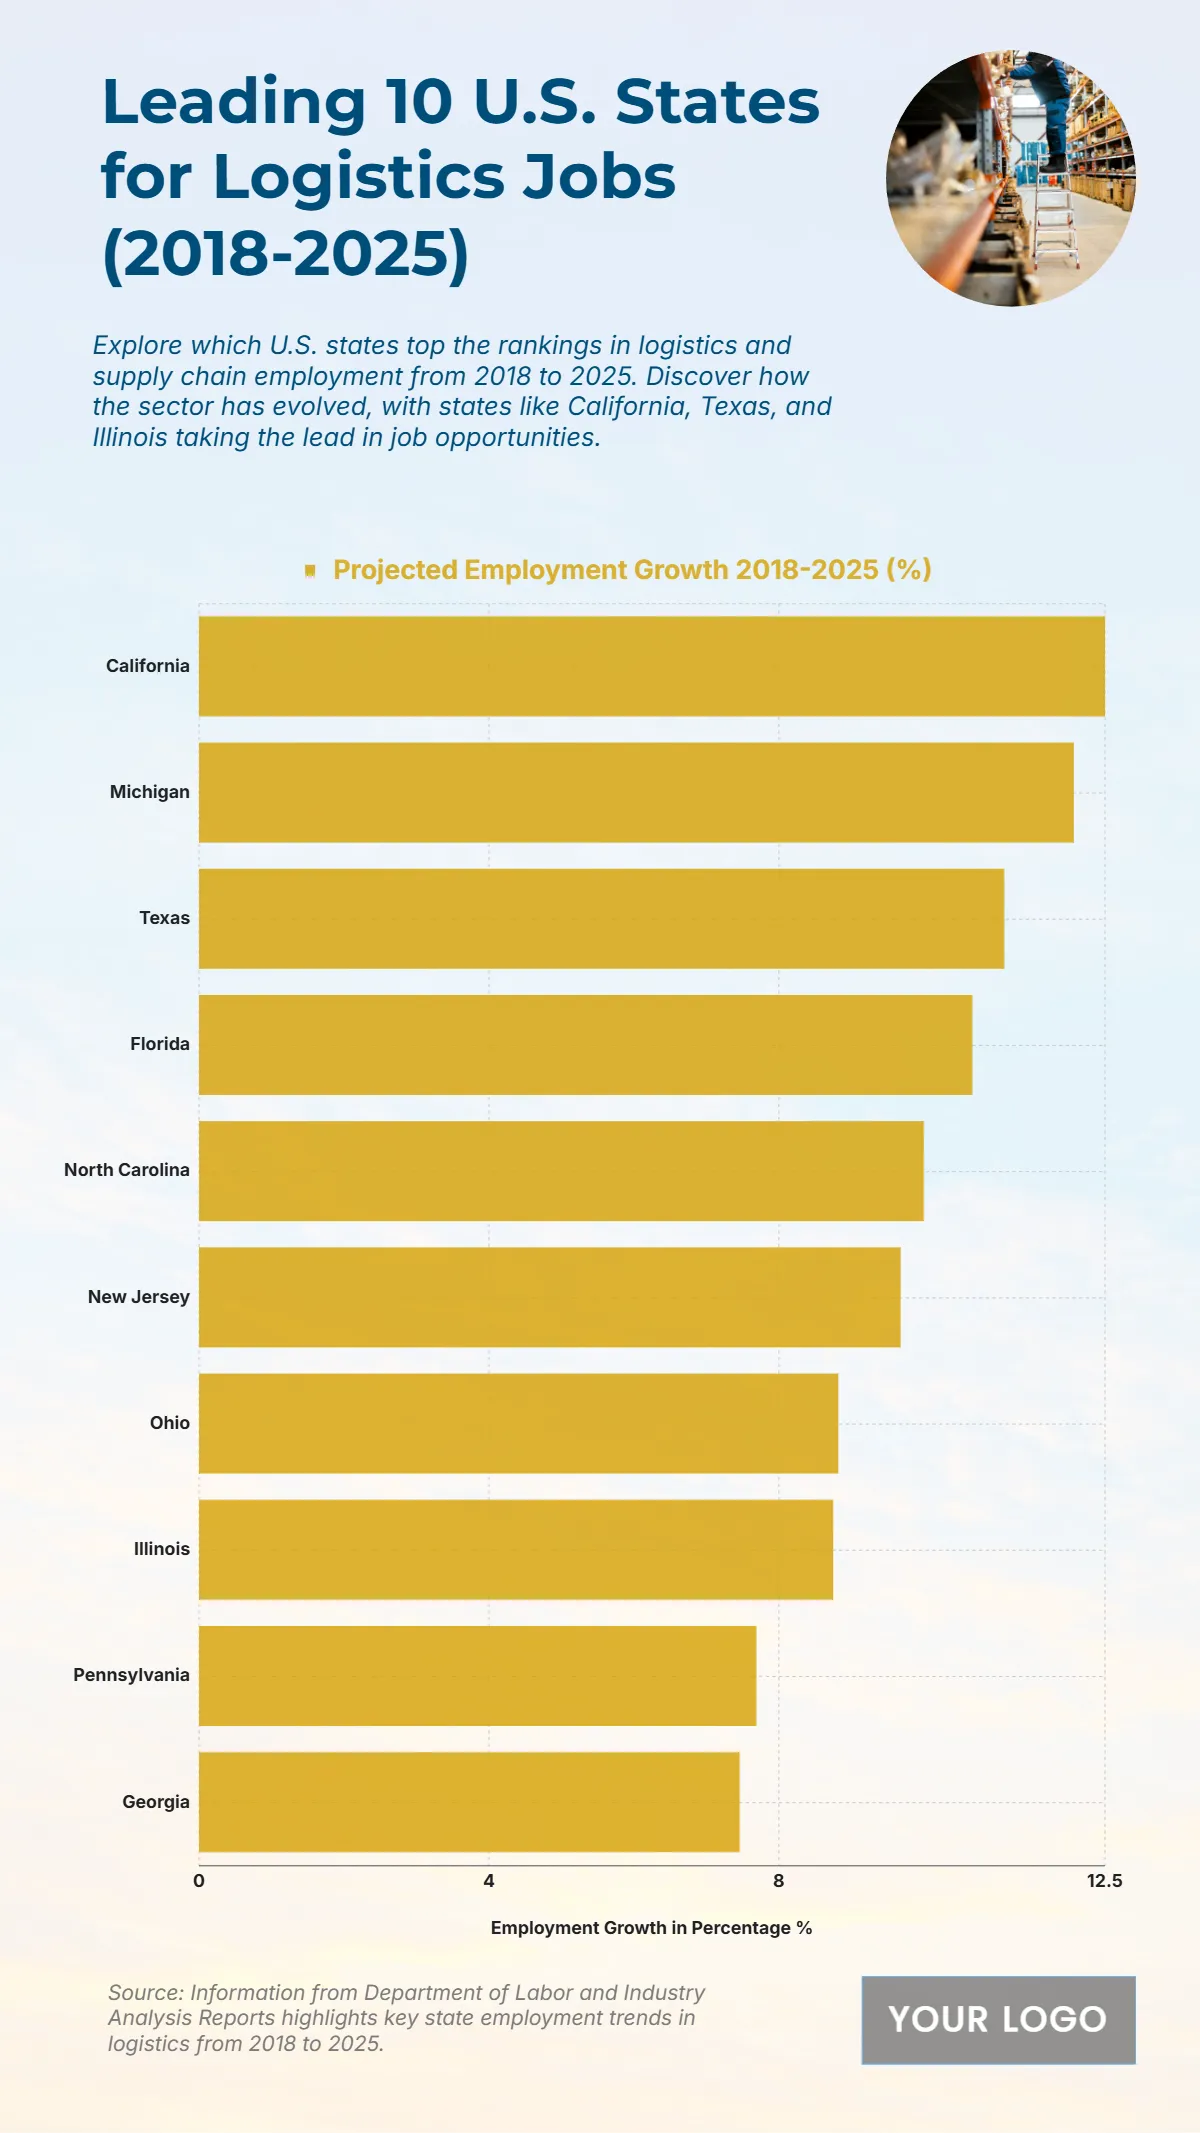
The chart outlines the projected employment growth in logistics jobs across the top 10 U.S. states from 2018 to 2025, showcasing the states leading in supply chain and transportation workforce expansion. California takes the top position with an impressive 12.5% projected growth, indicating its central role in national logistics and distribution. Michigan follows closely with 12.07%, reflecting its strong manufacturing and automotive logistics sector. Texas ranks third with 11.11%, supported by its large-scale trade and infrastructure networks. Florida also shows robust expansion at 10.67%, benefiting from tourism and port activity. North Carolina and New Jersey both project 10% growth, highlighting their growing logistics hubs. Mid-tier states like Ohio and Illinois record 8.82% and 8.75%, respectively, indicating stable growth. Rounding out the list are Pennsylvania at 7.69% and Georgia at 7.46%, reflecting consistent but moderate employment expansion in logistics by 2025.
| Labels | Projected Employment Growth 2018–2025 (%) |
|---|---|
| California | 12.5 |
| Michigan | 12.07 |
| Texas | 11.11 |
| Florida | 10.67 |
| North Carolina | 10 |
| New Jersey | 10 |
| Ohio | 8.82 |
| Illinois | 8.75 |
| Pennsylvania | 7.69 |
| Georgia | 7.46 |


