Free Top 10 States by Tourism Spending per Capita (2020–2025) Chart
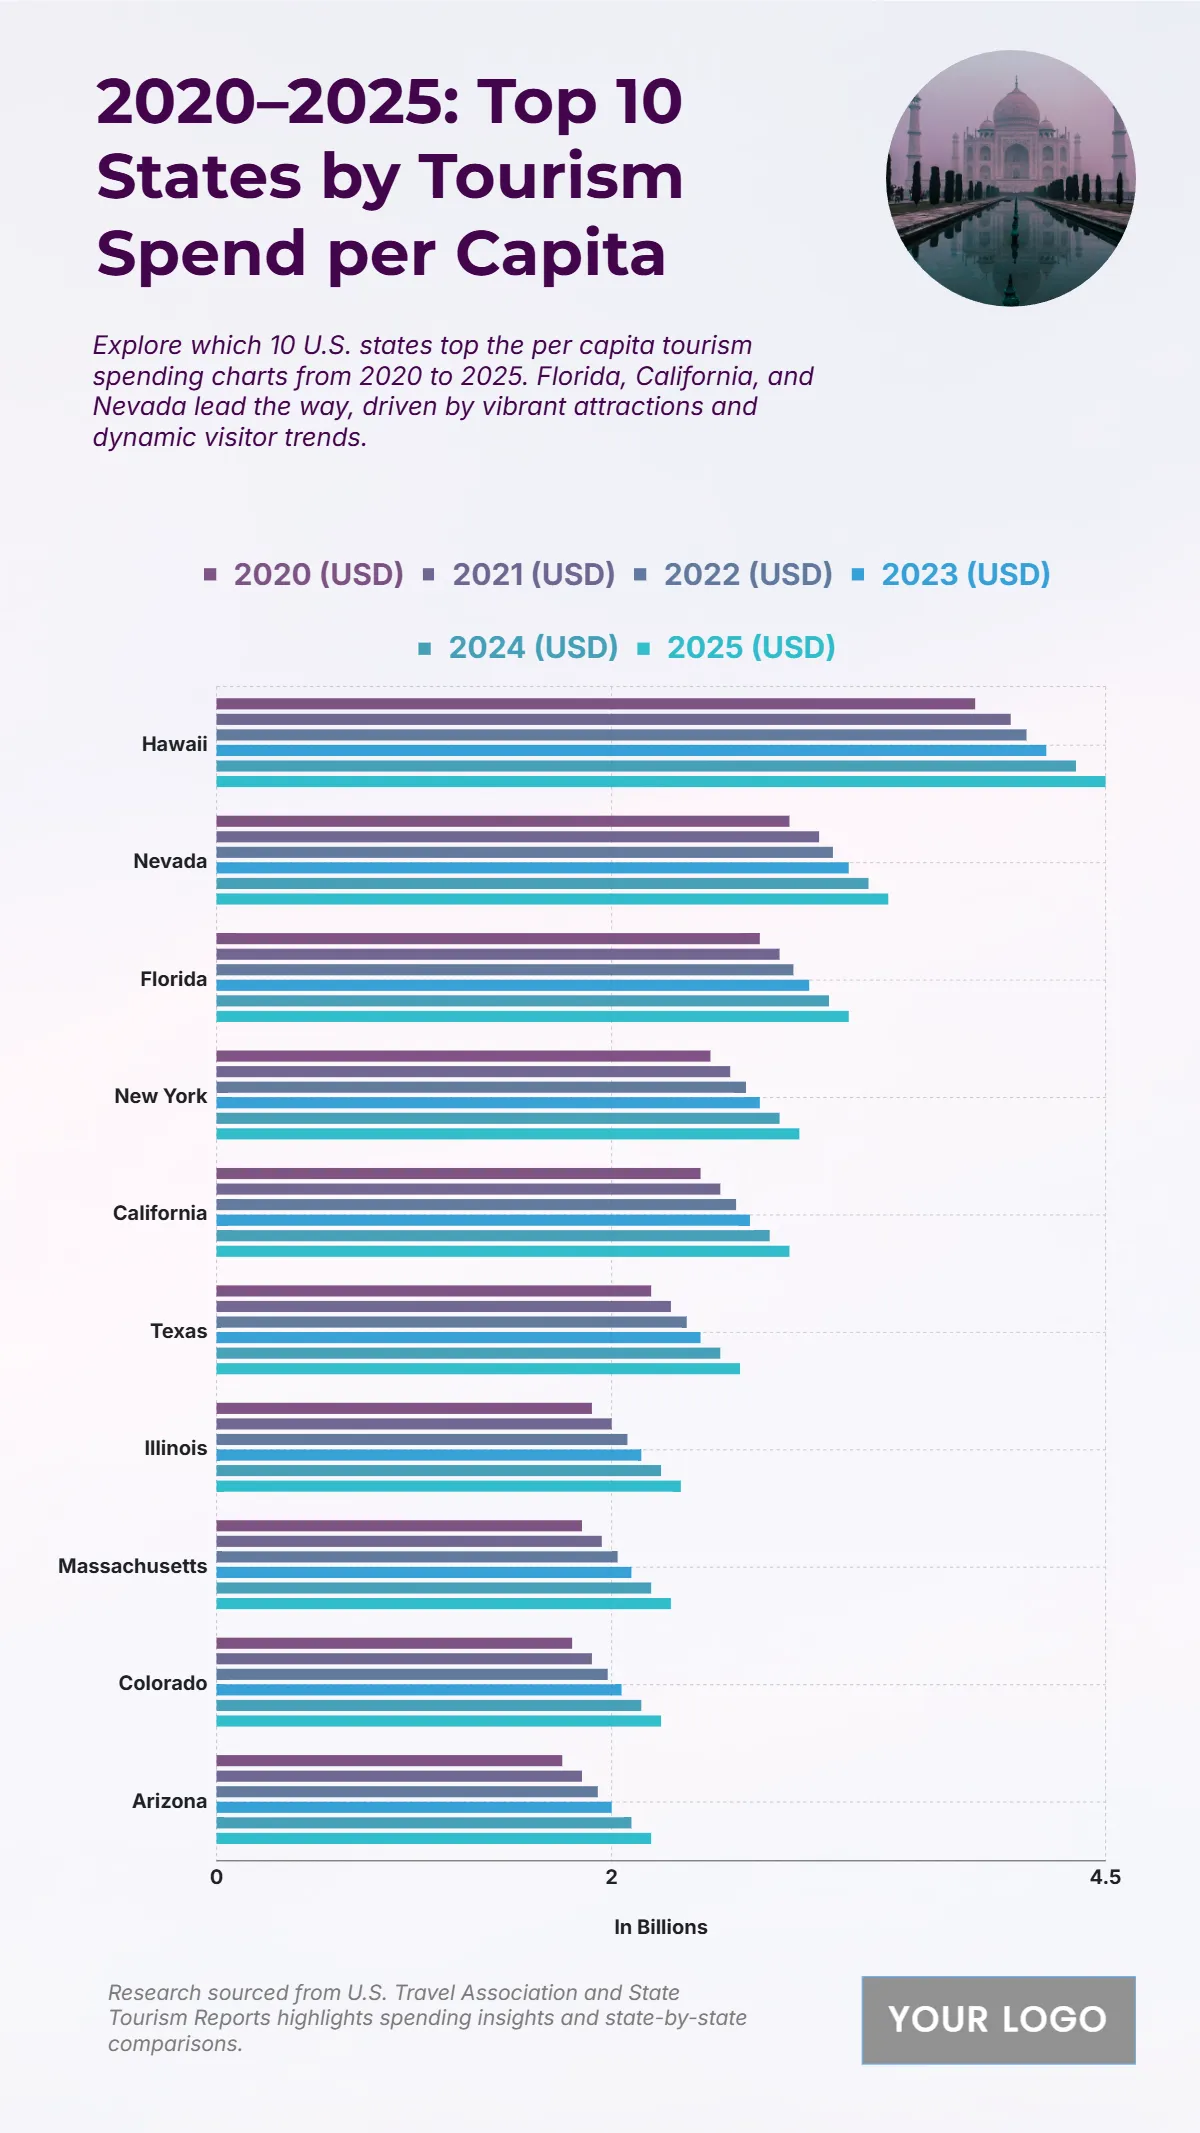
The chart illustrates the steady rise in tourism spending per capita across the top 10 U.S. states from 2020 to 2025, highlighting key destinations driving visitor expenditures. Hawaii consistently ranks first, increasing from $3.84 billion in 2020 to a projected $4.5 billion in 2025, reflecting its strong appeal as a premium tourist location. Nevada follows, growing from $2.9 billion to $3.4 billion, supported by major entertainment and hospitality sectors. Florida records growth from $2.75 billion to $3.2 billion, while New York moves from $2.5 billion to $2.95 billion. California shows a steady climb to $2.9 billion, and Texas reaches $2.65 billion. Mid-tier states like Illinois, Massachusetts, Colorado, and Arizona also show consistent increases, with Arizona reaching $2.2 billion by 2025. The upward trend across all states underscores a robust tourism recovery and expanding visitor spending nationwide.
| Labels | 2020 (USD) | 2021 (USD) | 2022 (USD) | 2023 (USD) | 2024 (USD) | 2025 (USD) |
|---|---|---|---|---|---|---|
| Hawaii | 3.84 | 4.02 | 4.1 | 4.2 | 4.35 | 4.5 |
| Nevada | 2.9 | 3.05 | 3.12 | 3.2 | 3.3 | 3.4 |
| Florida | 2.75 | 2.85 | 2.92 | 3 | 3.1 | 3.2 |
| New York | 2.5 | 2.6 | 2.68 | 2.75 | 2.85 | 2.95 |
| California | 2.45 | 2.55 | 2.63 | 2.7 | 2.8 | 2.9 |
| Texas | 2.2 | 2.3 | 2.38 | 2.45 | 2.55 | 2.65 |
| Illinois | 1.9 | 2 | 2.08 | 2.15 | 2.25 | 2.35 |
| Massachusetts | 1.85 | 1.95 | 2.03 | 2.1 | 2.2 | 2.3 |
| Colorado | 1.8 | 1.9 | 1.98 | 2.05 | 2.15 | 2.25 |
| Arizona | 1.75 | 1.85 | 1.93 | 2 | 2.1 | 2.2 |


