Free Top 20 U.S. States by Nonfarm Employment Growth (2018–2025) Chart
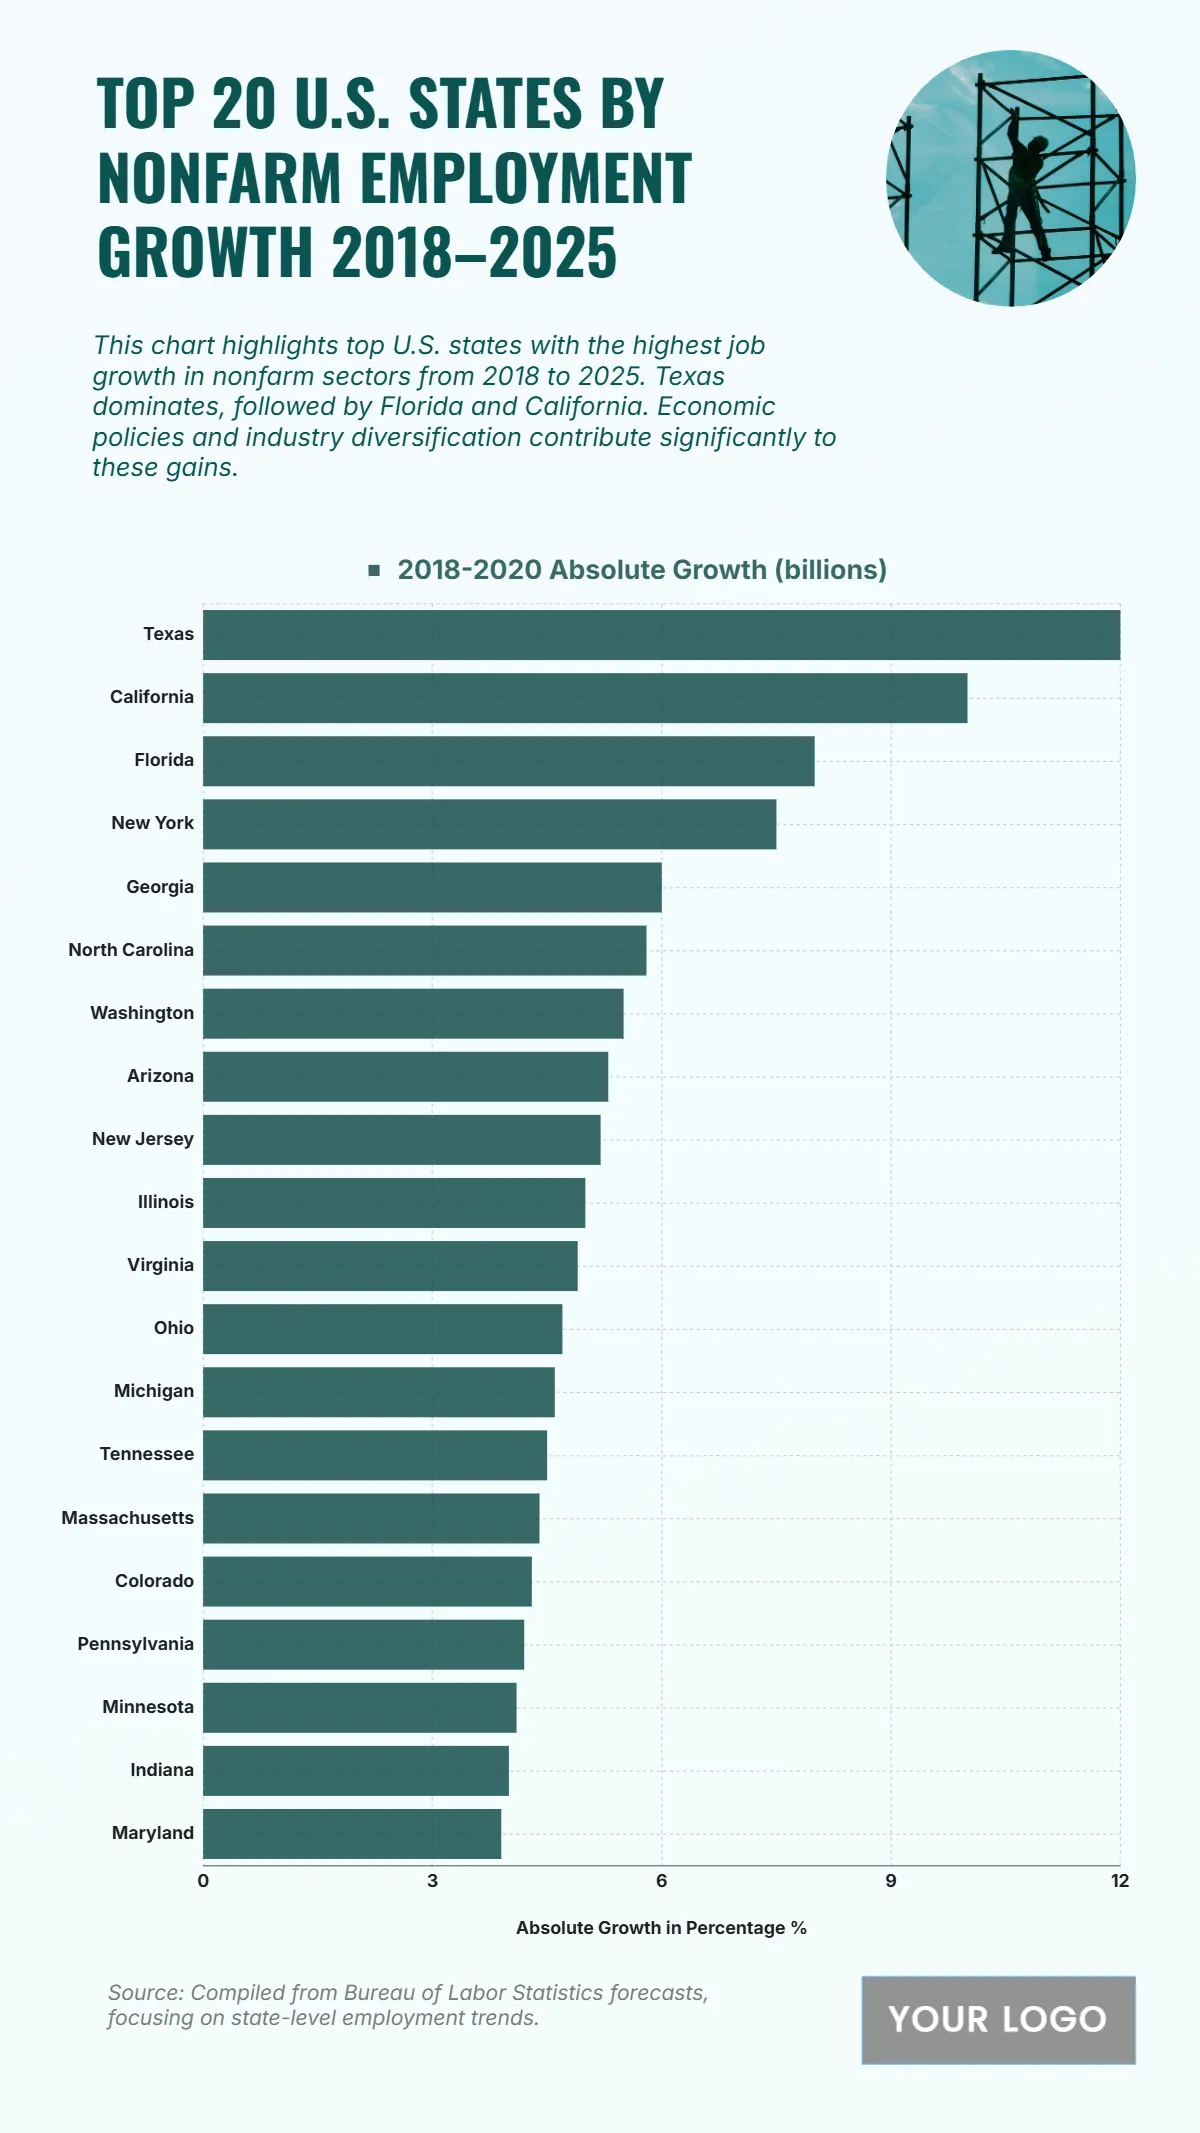
The chart shows the states with the highest growth in nonfarm employment between 2018 and 2025, revealing how labor markets are expanding across key economic regions. Texas leads with $12 billion in absolute growth, driven by its rapidly expanding industries and strong job market. California follows with $10 billion, reflecting its massive and diversified economy. Florida ranks third at $8 billion, while New York sees $7.5 billion in growth. Georgia, North Carolina, and Washington record notable increases ranging from $5.5 to $6 billion, showcasing their growing economic activity. Mid-range states like Arizona, New Jersey, Illinois, and Virginia show growth between $4.9 and $5.3 billion, indicating steady employment gains. The lower end includes Ohio, Michigan, Tennessee, Massachusetts, Colorado, Pennsylvania, Minnesota, Indiana, and Maryland, all above $3.9 billion, reflecting broad-based job growth across multiple states.
| Labels | 2018–2020 Absolute Growth (billions) |
|---|---|
| Texas | 12 |
| California | 10 |
| Florida | 8 |
| New York | 7.5 |
| Georgia | 6 |
| North Carolina | 5.8 |
| Washington | 5.5 |
| Arizona | 5.3 |
| New Jersey | 5.2 |
| Illinois | 5 |
| Virginia | 4.9 |
| Ohio | 4.7 |
| Michigan | 4.6 |
| Tennessee | 4.5 |
| Massachusetts | 4.4 |
| Colorado | 4.3 |
| Pennsylvania | 4.2 |
| Minnesota | 4.1 |
| Indiana | 4 |
| Maryland | 3.9 |


