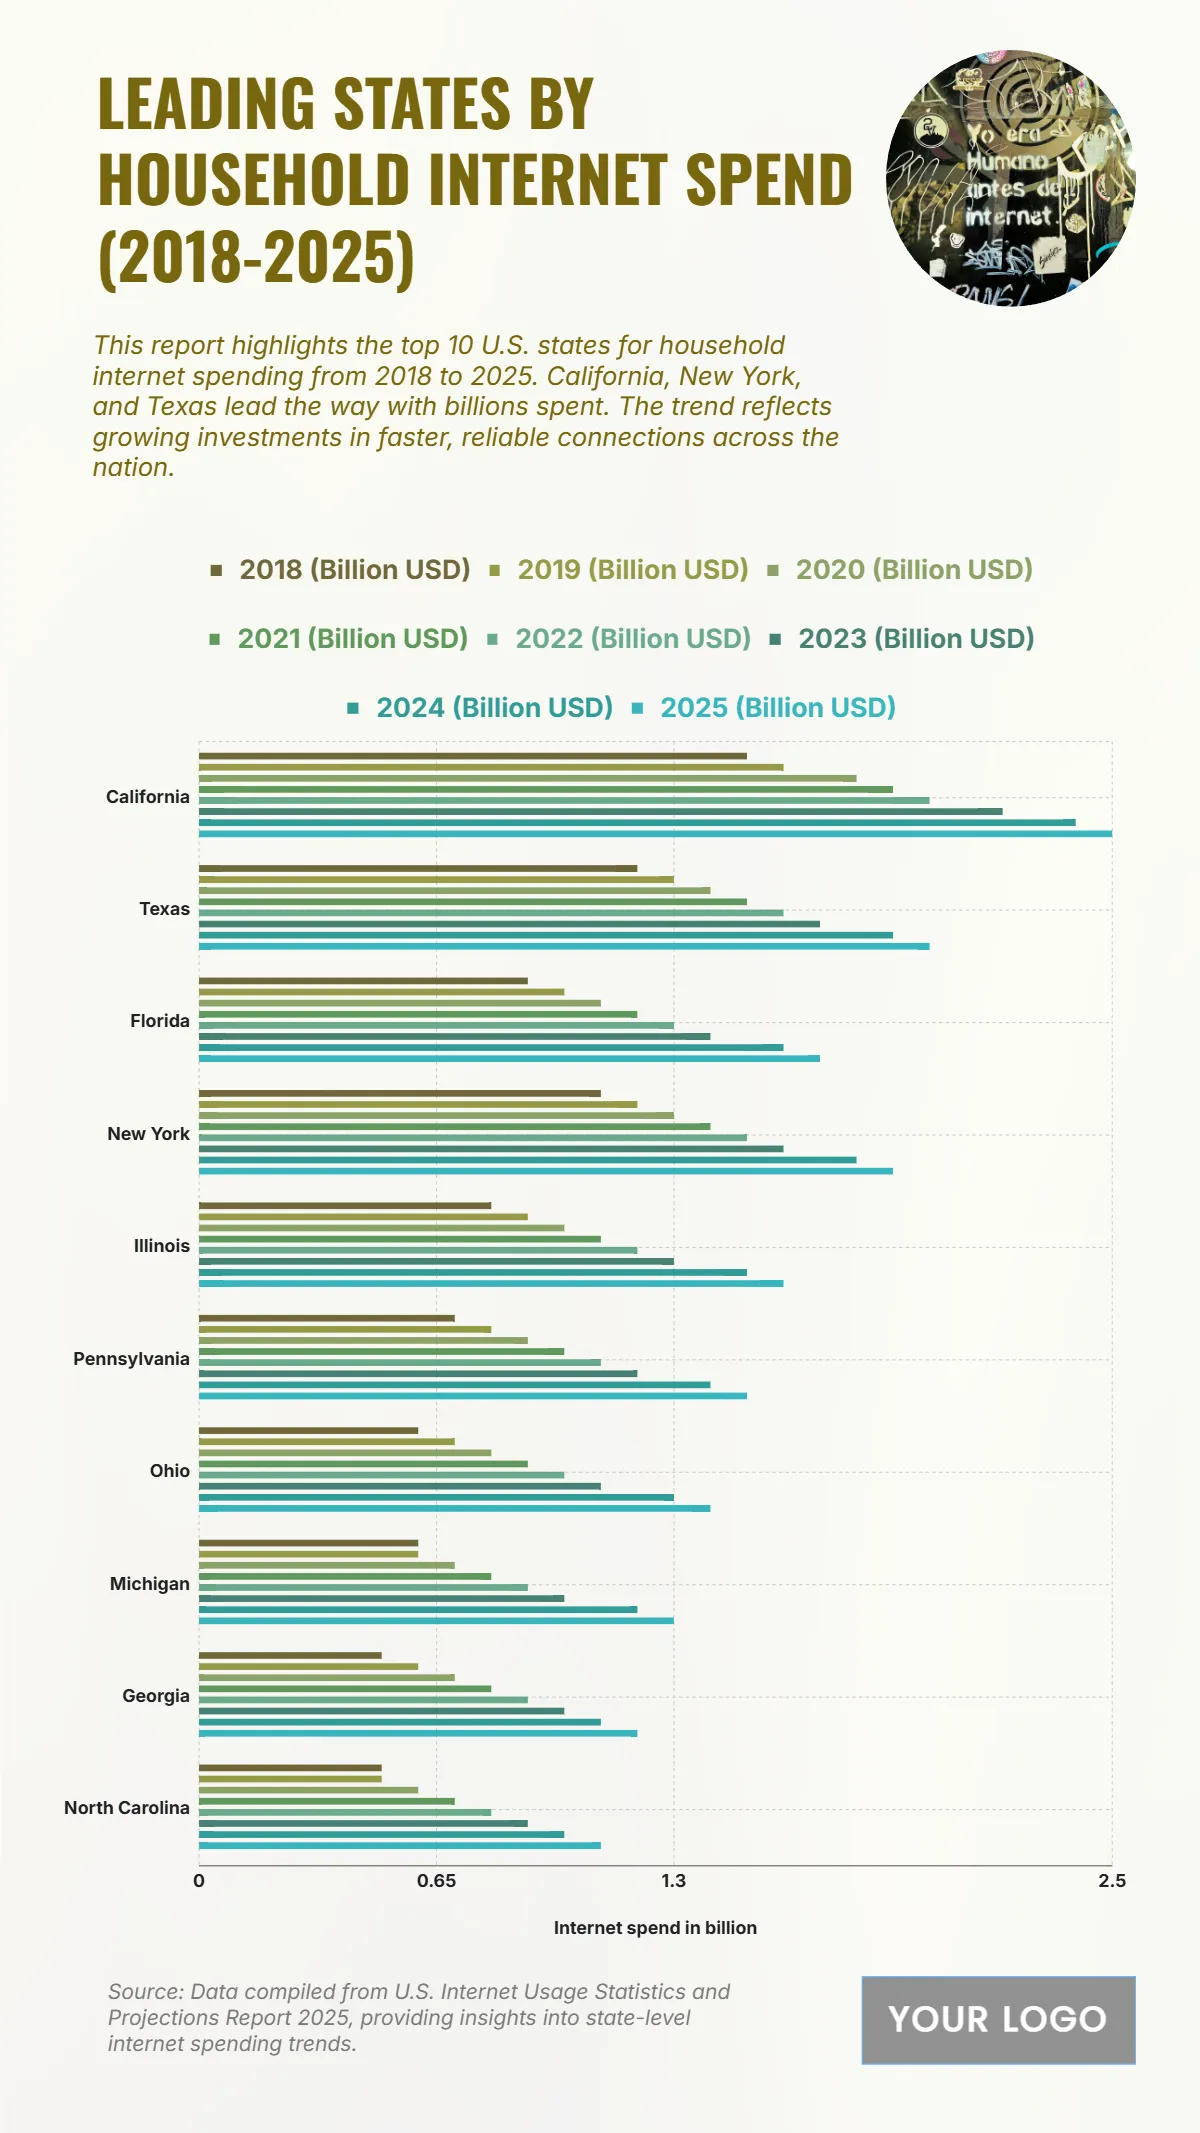
Free Top 10 States by Household Internet Spending (2018–2025) Chart
The chart highlights household internet spending trends across the top U.S. states between 2018 and 2025, reflecting the increasing demand for reliable and fast connectivity. California leads all states with a total spending of $6.3 billion, underscoring its large population and strong digital infrastructure. Texas follows with $5.4 billion, showing significant growth driven by rapid technological adoption. Florida comes next at $4.9 billion, closely followed by New York at $4.85 billion. Mid-range spenders include Illinois with $4.15 billion, Pennsylvania with $4.05 billion, and Ohio with $3.95 billion, reflecting steady digital engagement. Michigan records $3.85 billion, Georgia reports $3.75 billion, and North Carolina rounds out the top ten with $3.65 billion. Overall, the upward trend demonstrates strong internet usage growth, driven by work-from-home setups, streaming services, and digital access needs across the U.S.
| Labels | 2018–2025 (USD billions) |
|---|---|
| California | 6.3 |
| Texas | 5.4 |
| Florida | 4.9 |
| New York | 4.85 |
| Illinois | 4.15 |
| Pennsylvania | 4.05 |
| Ohio | 3.95 |
| Michigan | 3.85 |
| Georgia | 3.75 |
| North Carolina | 3.65 |


