Free Top 10 States by New Technology Company Formation (2020–2025)
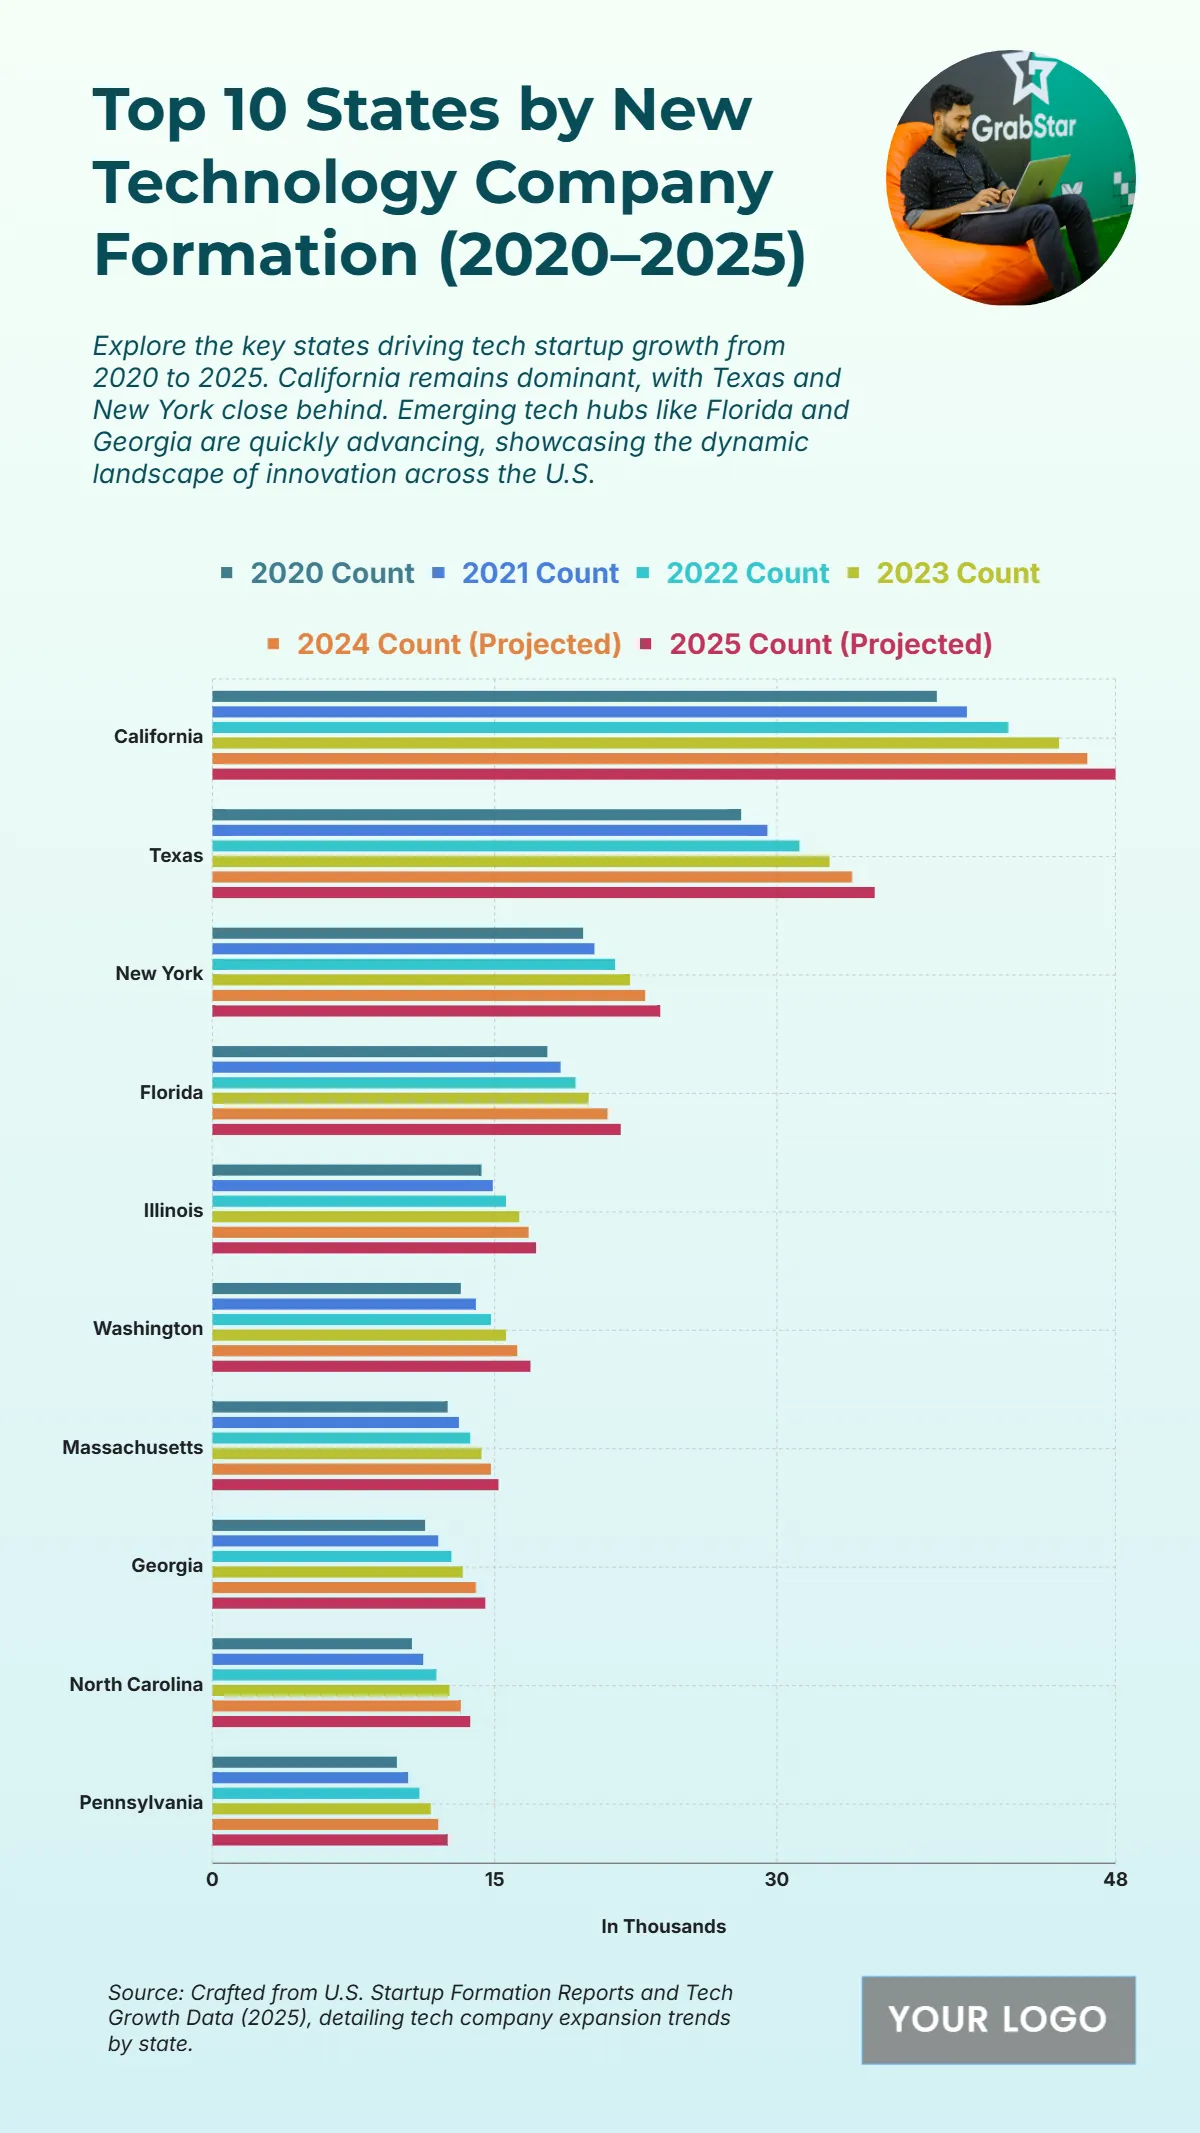
The chart presents the growth of new technology company formations across the top 10 U.S. states from 2020 to 2025. California leads consistently, growing from 38.5K in 2020 to a projected 48K in 2025, maintaining its dominance. Texas follows with an increase from 28.1K to 35.2K, showing strong momentum. New York records steady growth from 19.7K to 23.8K, while Florida rises from 17.8K to 21.7K. Mid-tier states like Illinois and Washington both project around 17K by 2025, reflecting solid expansion. Massachusetts and Georgia also advance, reaching 15.9K and 14.5K, respectively. Meanwhile, North Carolina grows from 10.6K to 13.7K, and Pennsylvania from 9.8K to 12.5K. The chart emphasizes California’s consistent leadership, with Texas and New York closing the gap, while southern and eastern states show promising acceleration in innovation and startup activity by 2025.
| Labels | 2020 Count | 2021 Count | 2022 Count | 2023 Count | 2024 Count (Projected) | 2025 Count (Projected) |
|---|---|---|---|---|---|---|
| California | 38.5 | 40.1 | 42.3 | 45 | 46.5 | 48 |
| Texas | 28.1 | 29.5 | 31.2 | 32.8 | 34 | 35.2 |
| New York | 19.7 | 20.3 | 21.4 | 22.2 | 23 | 23.8 |
| Florida | 17.8 | 18.5 | 19.3 | 20 | 21 | 21.7 |
| Illinois | 14.3 | 14.9 | 15.6 | 16.3 | 16.8 | 17.2 |
| Washington | 13.2 | 13.4 | 14.8 | 15.6 | 16.2 | 16.9 |
| Massachusetts | 12.5 | 13.1 | 13.7 | 14.3 | 14.8 | 15.9 |
| Georgia | 11.3 | 12 | 12.7 | 13.3 | 14 | 14.5 |
| North Carolina | 10.6 | 11.2 | 11.9 | 12.6 | 13.2 | 13.7 |
| Pennsylvania | 9.8 | 10.4 | 11 | 11.6 | 12 | 12.5 |


