Free Top 20 U.S. States by Median Rent (2018–2025)
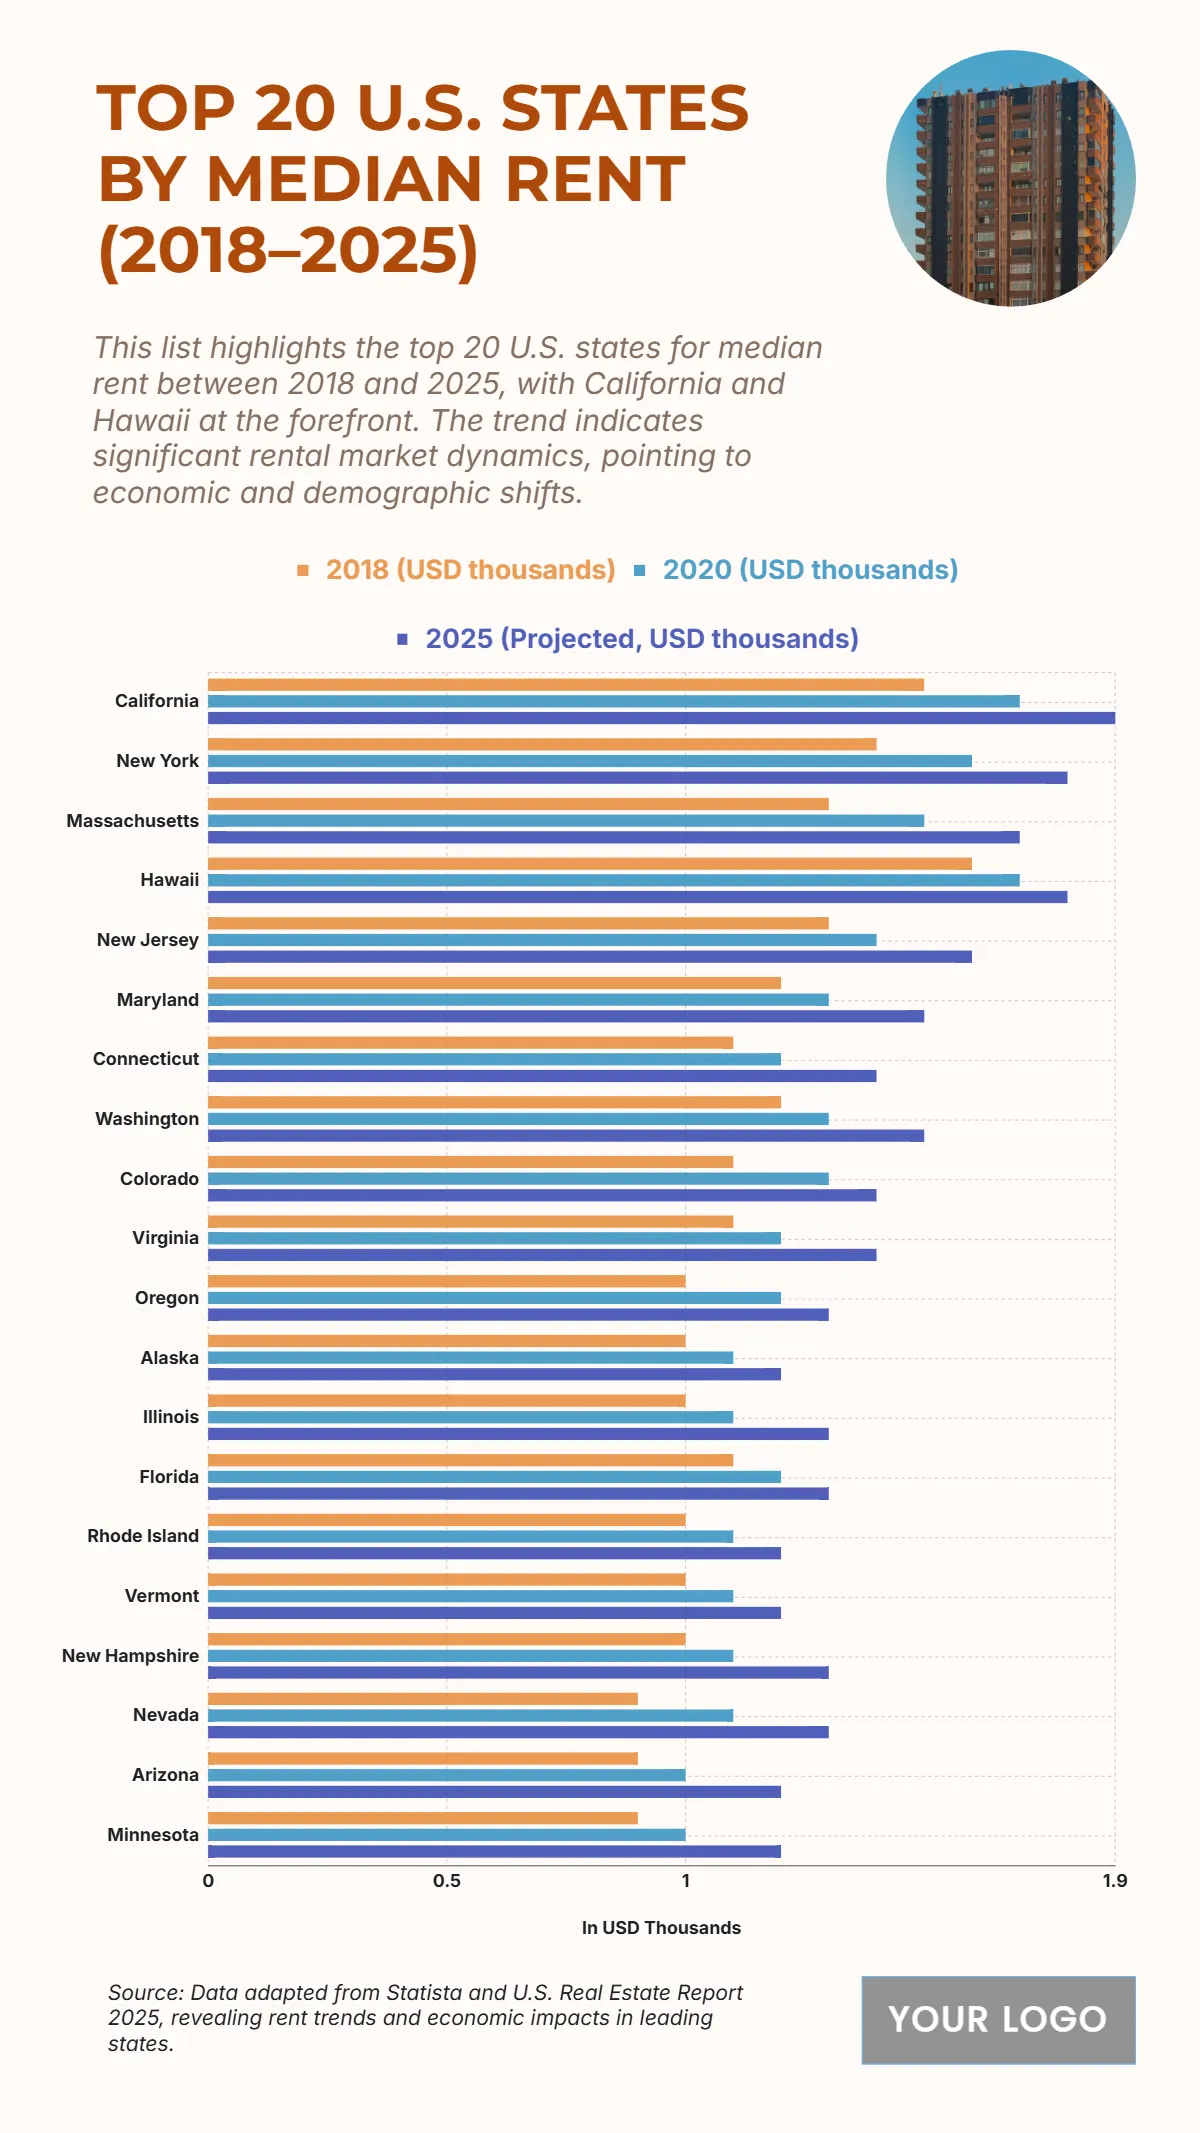
The chart tracks the median rent across the top 20 U.S. states from 2018 to 2025, highlighting clear upward trends driven by economic and demographic shifts. California remains the most expensive, climbing from $1.5K in 2018 to $1.9K in 2025. Hawaii and New York follow closely at $1.8K, reflecting sustained high housing demand. Massachusetts rises from $1.3K to $1.7K, while New Jersey grows steadily to $1.6K. Mid-tier states like Maryland, Connecticut, and Washington project rents of $1.5–1.6K by 2025, indicating notable increases. Colorado, Virginia, and Oregon remain in the $1.3–1.4K range, while Alaska, Illinois, Florida, Rhode Island, and Vermont hover around $1.2–1.3K. More affordable states like Nevada, Arizona, and Minnesota increase from $0.9K to $1.2K, reflecting growing but still relatively lower rent levels. The trend shows rising costs across all states, emphasizing nationwide housing market pressures through 2025.
| Labels | 2018 (USD thousands) | 2020 (USD thousands) | 2025 (Projected, USD thousands) |
|---|---|---|---|
| California | 1.5 | 1.7 | 1.9 |
| New York | 1.4 | 1.6 | 1.8 |
| Massachusetts | 1.3 | 1.5 | 1.7 |
| Hawaii | 1.6 | 1.7 | 1.8 |
| New Jersey | 1.3 | 1.4 | 1.6 |
| Maryland | 1.2 | 1.3 | 1.5 |
| Connecticut | 1.1 | 1.2 | 1.4 |
| Washington | 1.2 | 1.3 | 1.5 |
| Colorado | 1.1 | 1.3 | 1.4 |
| Virginia | 1.1 | 1.2 | 1.3 |
| Oregon | 1 | 1.2 | 1.3 |
| Alaska | 1 | 1.1 | 1.2 |
| Illinois | 1 | 1.1 | 1.3 |
| Florida | 1.2 | 1.1 | 1.2 |
| Rhode Island | 1 | 1.1 | 1.2 |
| Vermont | 1 | 1.1 | 1.2 |
| New Hampshire | 1 | 1.1 | 1.3 |
| Nevada | 0.9 | 1 | 1.2 |
| Arizona | 0.9 | 1 | 1.2 |
| Minnesota | 0.9 | 1 | 1.2 |


