Free Top 10 States by Tourism-Related Job Growth (2018–2025)
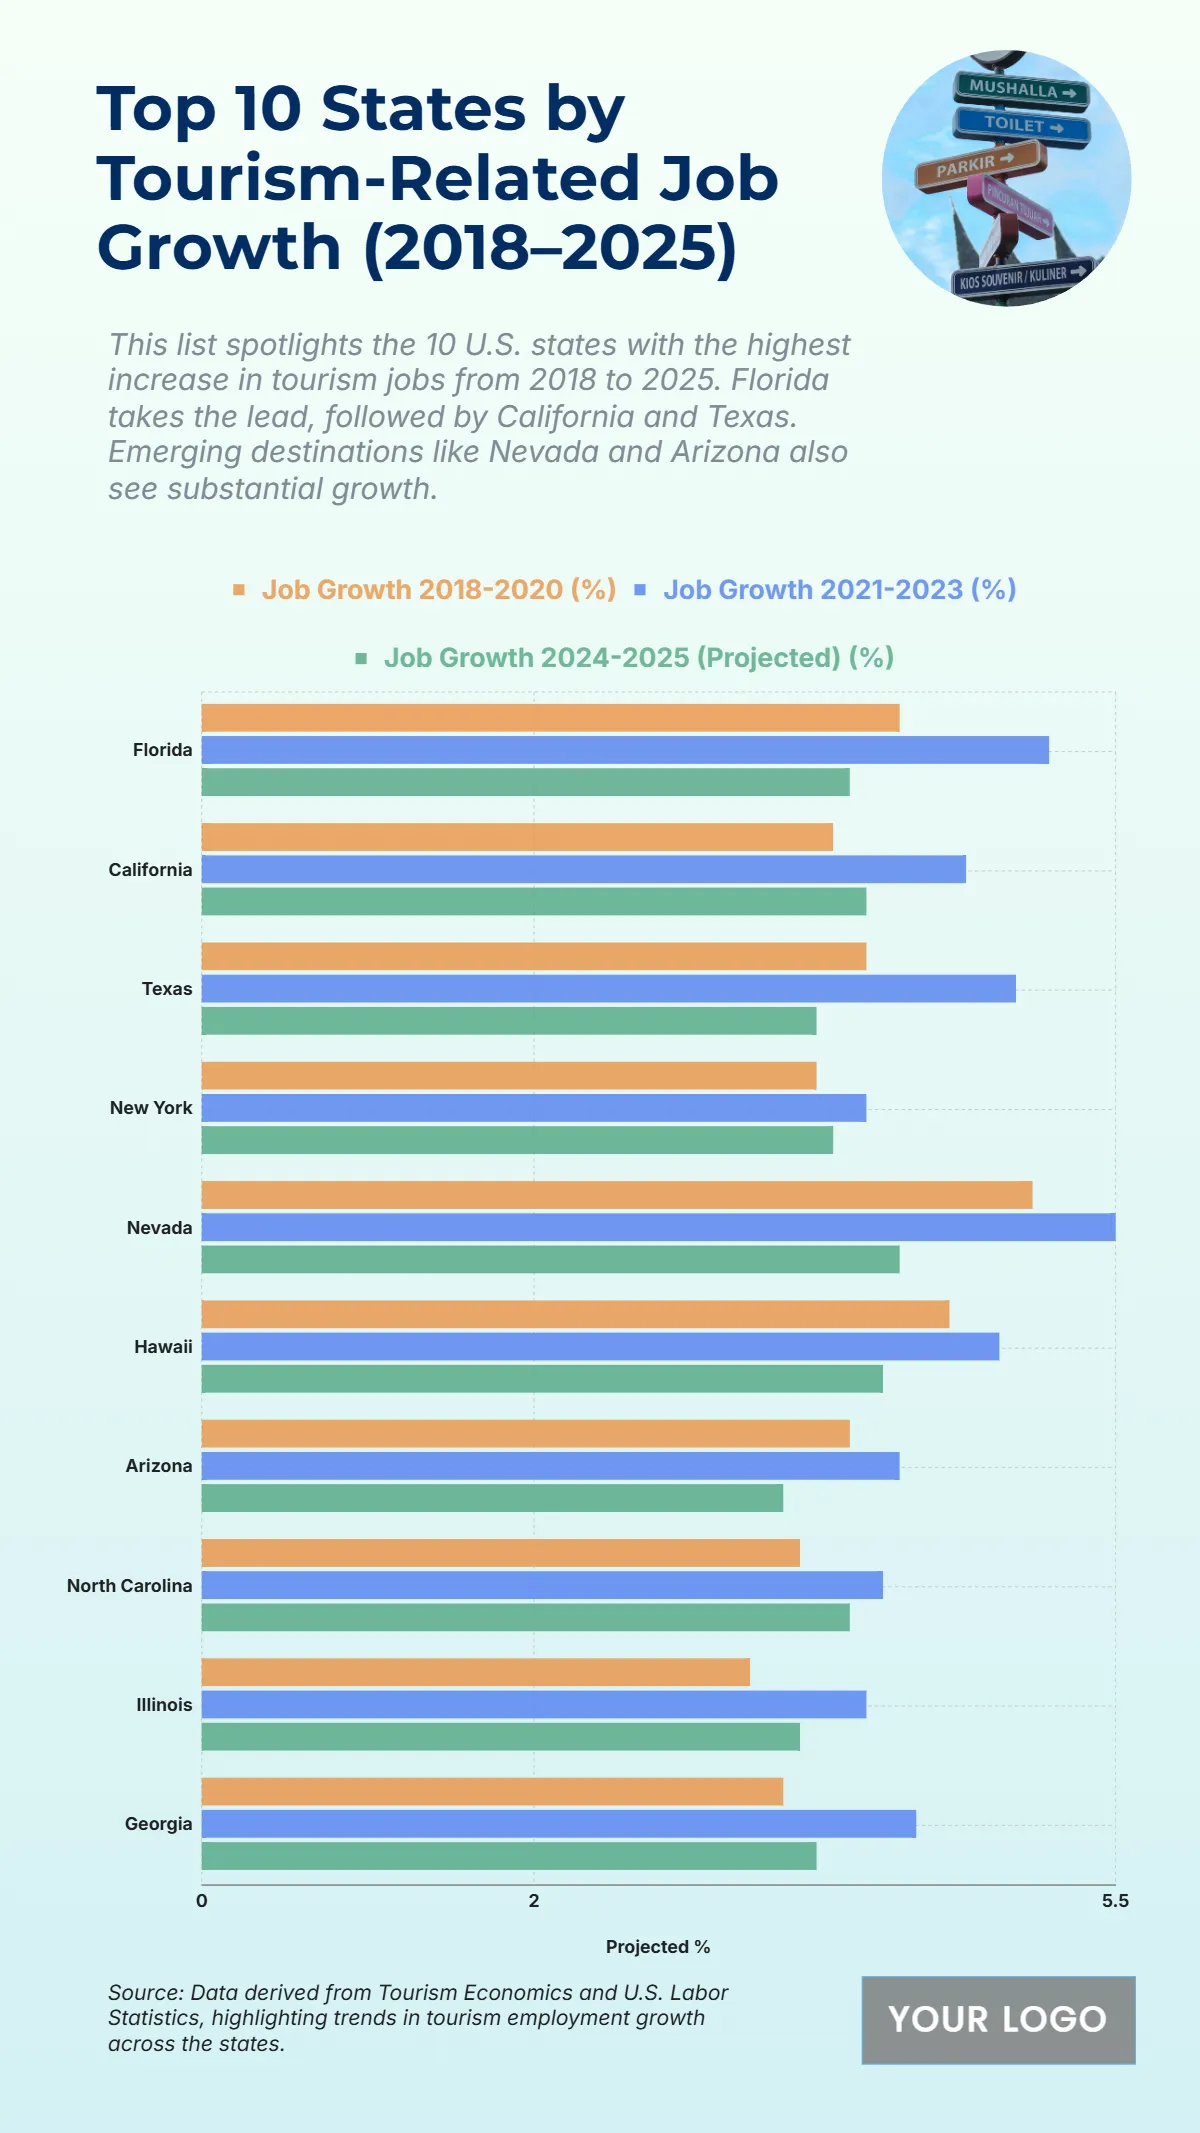
The chart shows the steady rise in tourism-related job growth across the top 10 U.S. states from 2018 to 2025, highlighting the industry’s resilience and post-pandemic recovery. Florida leads with job growth increasing from 4.2% (2018–2020) to 5.1% (2021–2023) and a projected 3.9% (2024–2025). Nevada follows closely, climbing from 5% to 5.5%, with a projected 4.2%, reflecting its strong tourism dependency. California records growth from 3.8% to 4.6%, stabilizing at 4% in projections, while Texas shows consistent expansion from 4% to 4.9%, ending at 3.7%. Hawaii remains robust, reaching 4.8% and expected to stay at 4.1%. States like New York, Arizona, North Carolina, Illinois, and Georgia display moderate yet sustained growth rates between 3.5%–4%, indicating broad tourism recovery. The chart underscores how diverse states are regaining momentum, with Sunbelt and coastal destinations driving employment resurgence by 2025.
| Labels | Job Growth 2018–2020 (%) | Job Growth 2021–2023 (%) | Job Growth 2024–2025 (Projected) (%) |
|---|---|---|---|
| Florida | 4.2 | 5.1 | 3.9 |
| California | 3.8 | 4.6 | 4 |
| Texas | 4 | 4.9 | 3.7 |
| New York | 3.7 | 4 | 3.8 |
| Nevada | 5 | 5.5 | 4.2 |
| Hawaii | 4.5 | 4.8 | 4.1 |
| Arizona | 3.9 | 4.2 | 3.5 |
| North Carolina | 3.6 | 4.1 | 3.9 |
| Illinois | 3.3 | 4 | 3.6 |
| Georgia | 3.5 | 4.3 | 3.7 |


