Free Top 20 U.S. States by Construction Sector Employment (2020–2025)
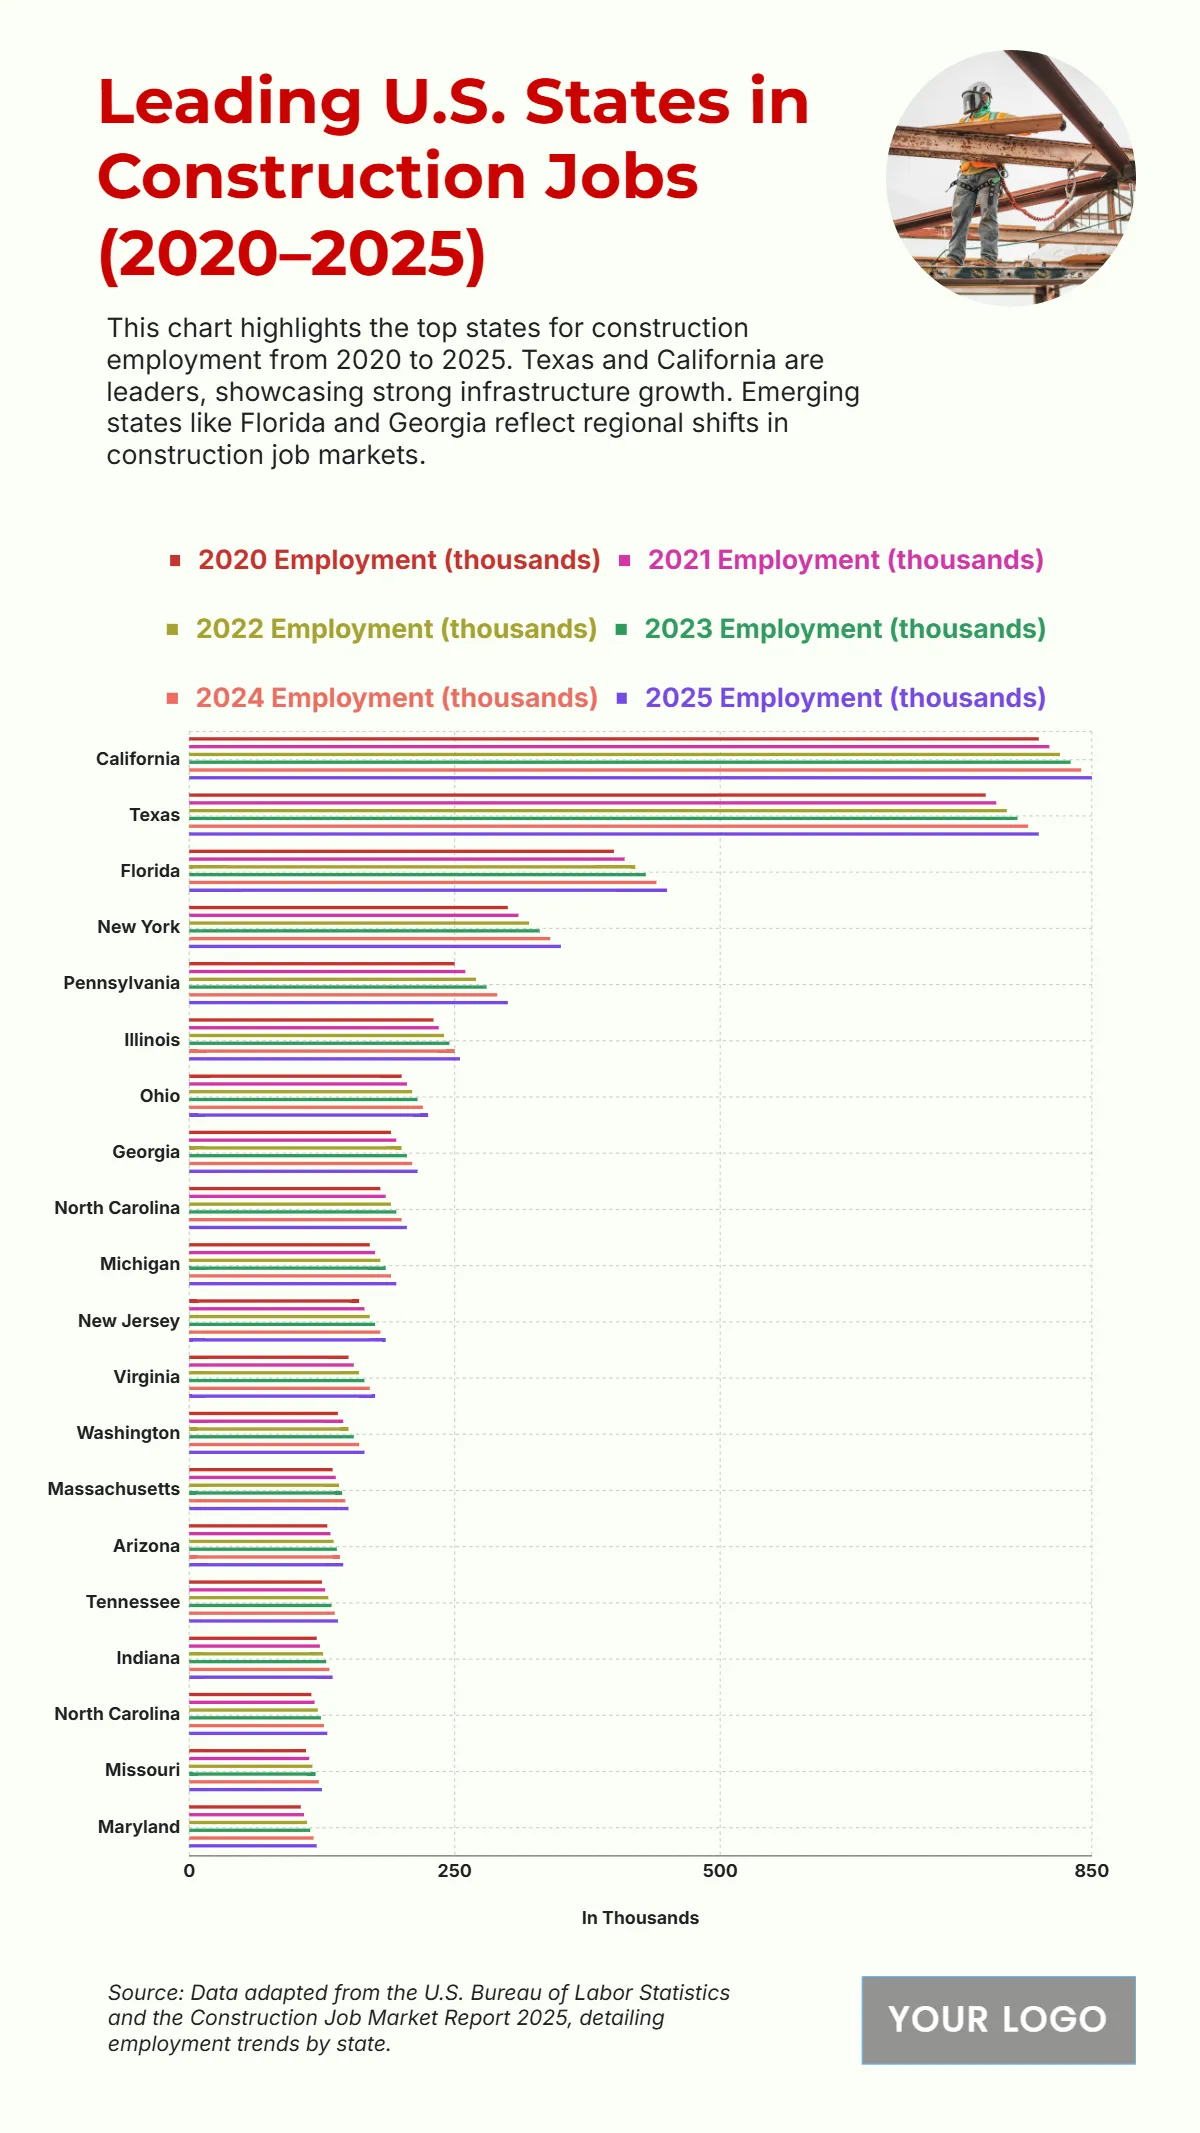
The chart presents construction job employment growth across U.S. states from 2020 to 2025, showing strong infrastructure and development trends. California leads with employment rising from 800,000 in 2020 to 820,000 in 2022, reflecting its continued dominance in construction activity. Texas follows closely, increasing from 750,000 to 770,000, highlighting robust economic expansion. Florida grows from 400,000 to 420,000, while New York climbs from 300,000 to 320,000. Mid-tier states such as Pennsylvania and Illinois show consistent gains, reaching 270,000 and 240,000, respectively. Ohio, Georgia, and North Carolina remain steady around 200,000, 200,000, and 190,000, showing healthy market activity. States like Michigan, New Jersey, and Virginia follow in the 160,000–180,000 range. The lower end includes Washington, Massachusetts, Arizona, Tennessee, Indiana, and Missouri, still exhibiting gradual growth. Overall, the data reflects stable and widespread construction job expansion nationwide.
| Labels | 2020 Employment (thousands) | 2021 Employment (thousands) | 2022 Employment (thousands) |
|---|---|---|---|
| California | 800 | 810 | 820 |
| Texas | 750 | 760 | 770 |
| Florida | 400 | 410 | 420 |
| New York | 300 | 310 | 320 |
| Pennsylvania | 250 | 260 | 270 |
| Illinois | 230 | 235 | 240 |
| Ohio | 200 | 205 | 210 |
| Georgia | 190 | 195 | 200 |
| North Carolina | 180 | 185 | 190 |
| Michigan | 170 | 175 | 180 |
| New Jersey | 160 | 165 | 170 |
| Virginia | 150 | 155 | 160 |
| Washington | 140 | 145 | 150 |
| Massachusetts | 135 | 138 | 141 |
| Arizona | 130 | 133 | 136 |
| Tennessee | 125 | 128 | 131 |
| Indiana | 120 | 123 | 126 |
| North Carolina | 115 | 118 | 121 |
| Missouri | 110 | 113 | 116 |


