Free Top 20 U.S. States by Water Utility Spending (2018–2025)
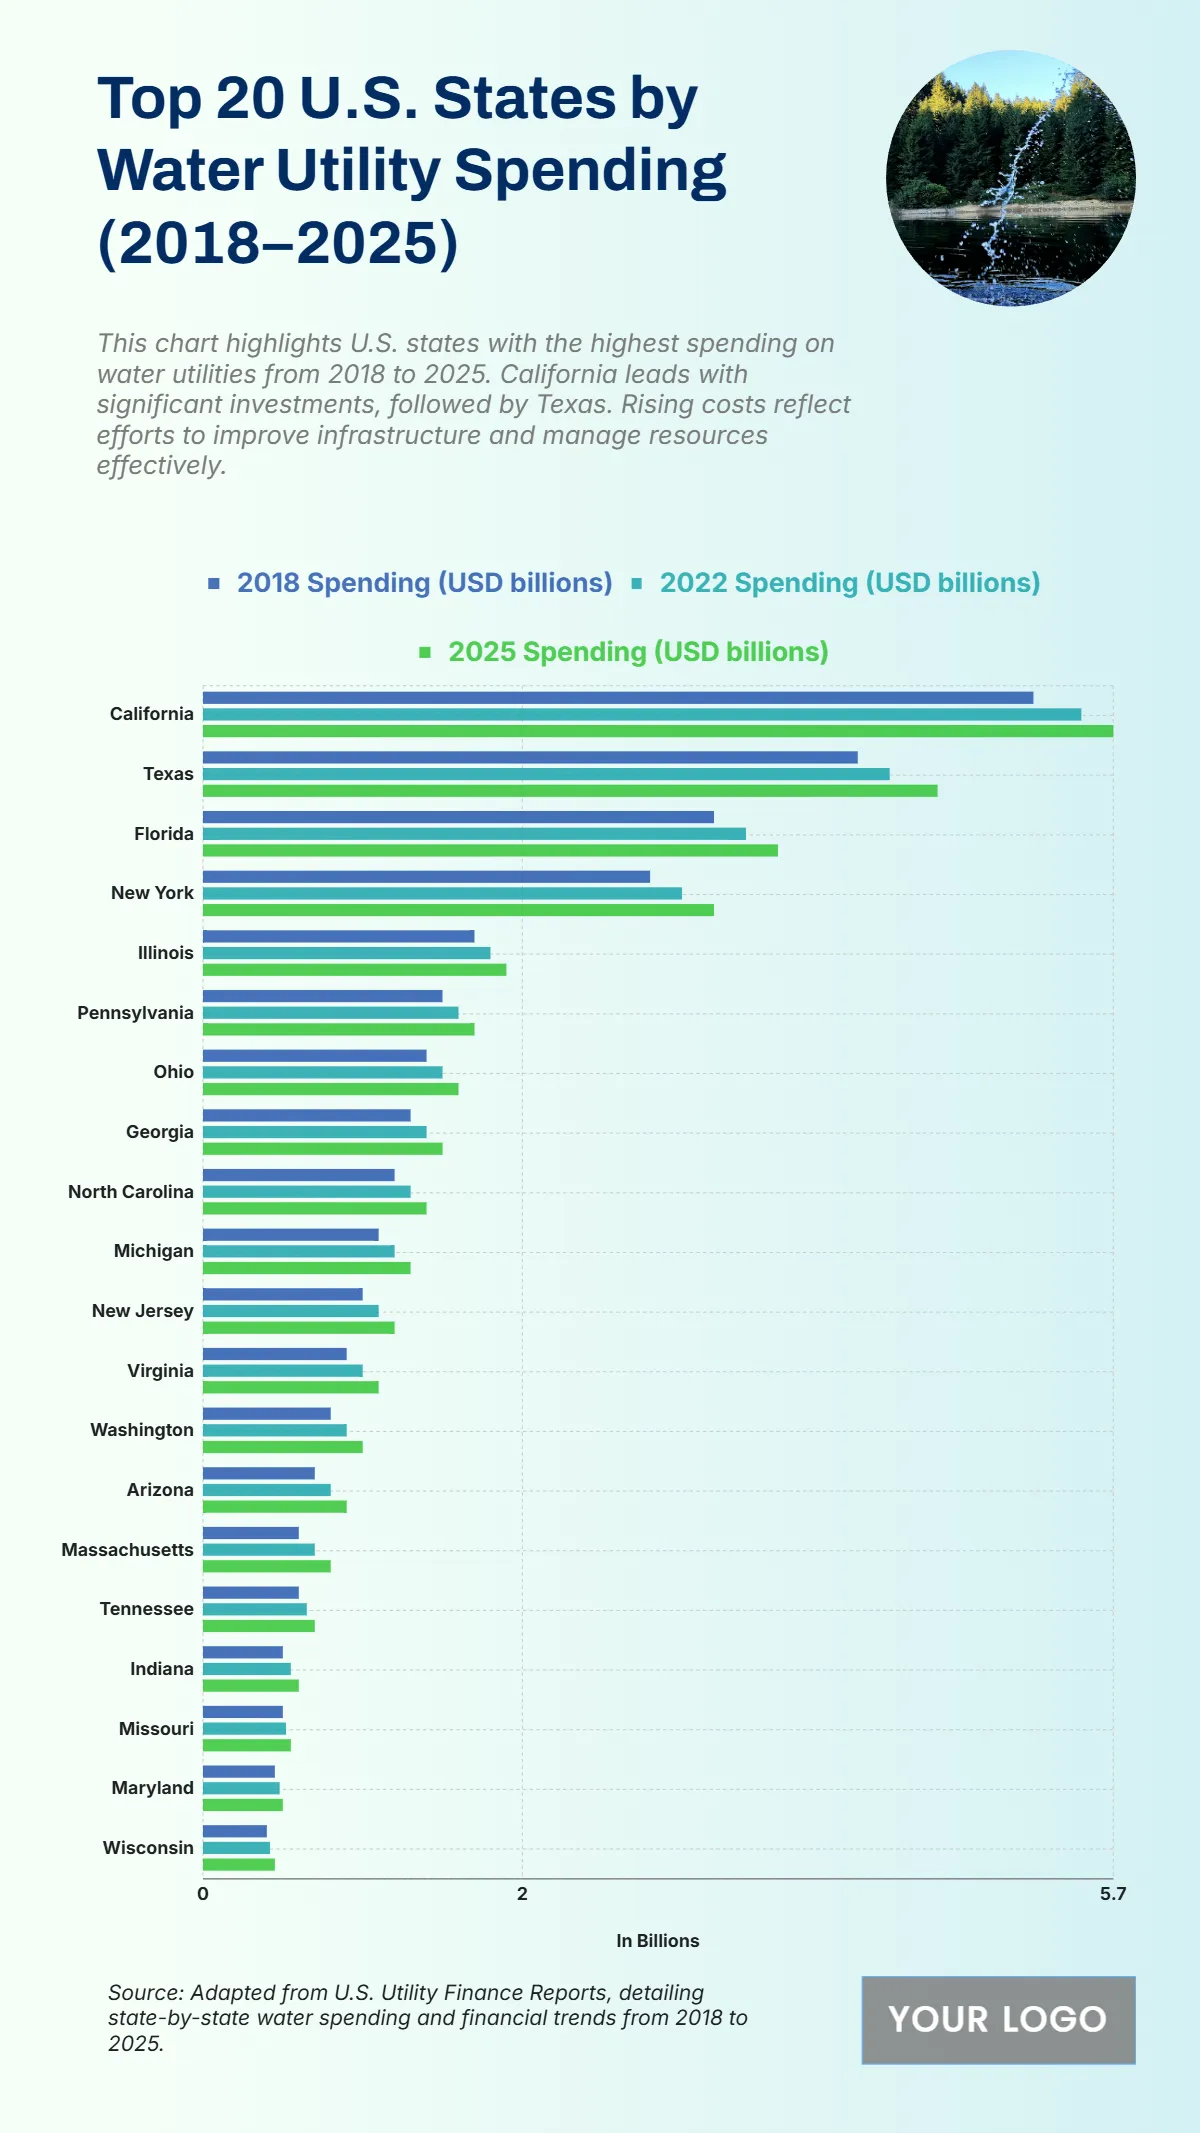
The chart shows the steady increase in water utility spending across 20 U.S. states from 2018 to 2025, reflecting infrastructure investments and resource management initiatives. California consistently leads, with spending rising from $5.2 billion in 2018 to $5.7 billion in 2025. Texas follows closely, increasing from $4.1 billion to $4.6 billion, while Florida grows from $3.2 billion to $3.6 billion. New York climbs from $2.8 billion to $3.2 billion, and Illinois from $1.7 billion to $1.9 billion. Other states show moderate but steady increases, including Pennsylvania from $1.5 billion to $1.7 billion, Ohio from $1.4 billion to $1.6 billion, and Georgia from $1.3 billion to $1.5 billion. Even smaller states like Maryland and Wisconsin reflect gradual growth, reaching $0.5 billion and $0.45 billion respectively by 2025. The overall upward trend highlights national efforts to modernize water systems and ensure sustainable supply.
| Labels | 2018 Spending (USD billions) | 2022 Spending (USD billions) | 2025 Spending (USD billions) |
|---|---|---|---|
| California | 5.2 | 5.5 | 5.7 |
| Texas | 4.1 | 4.3 | 4.6 |
| Florida | 3.2 | 3.4 | 3.6 |
| New York | 2.8 | 3.0 | 3.2 |
| Illinois | 1.7 | 1.8 | 1.9 |
| Pennsylvania | 1.5 | 1.6 | 1.7 |
| Ohio | 1.4 | 1.5 | 1.6 |
| Georgia | 1.3 | 1.4 | 1.5 |
| North Carolina | 1.2 | 1.3 | 1.4 |
| Michigan | 1.1 | 1.2 | 1.3 |
| New Jersey | 1.0 | 1.1 | 1.2 |
| Virginia | 0.9 | 1.0 | 1.1 |
| Washington | 0.8 | 0.9 | 1.0 |
| Arizona | 0.7 | 0.8 | 0.9 |
| Massachusetts | 0.6 | 0.7 | 0.8 |
| Tennessee | 0.6 | 0.65 | 0.7 |
| Indiana | 0.5 | 0.55 | 0.6 |
| Missouri | 0.5 | 0.52 | 0.55 |
| Maryland | 0.45 | 0.48 | 0.5 |
| Wisconsin | 0.4 | 0.42 | 0.45 |


