Free U.S. Top 10 States with the Highest Tax Revenue per Capita (2020–2025)
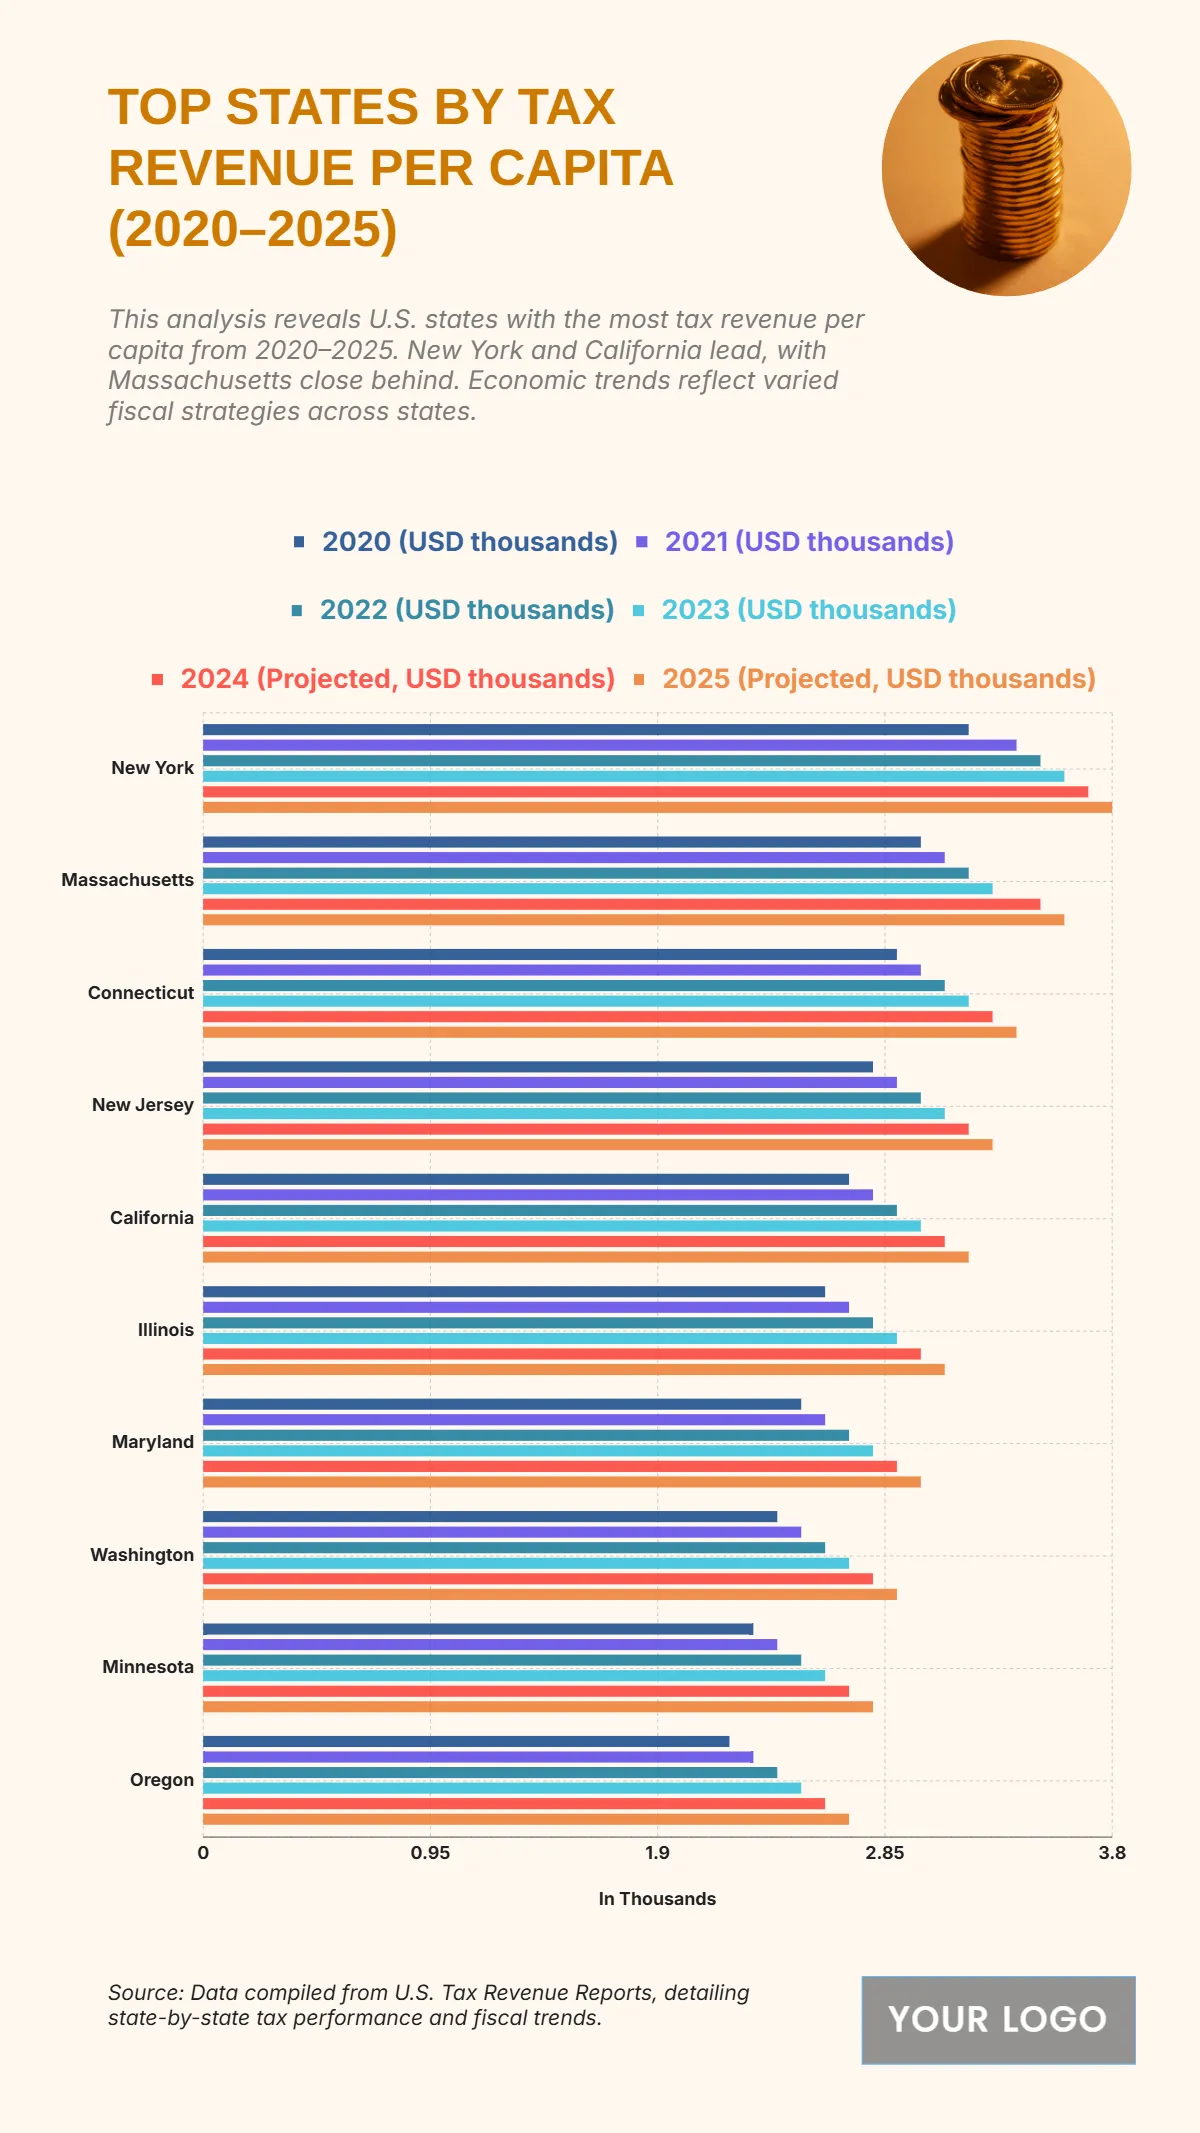
The chart shows the steady rise in tax revenue per capita across leading U.S. states from 2020 to 2025, with consistent upward trends indicating robust fiscal growth. New York leads throughout the period, increasing from 3.2 thousand USD in 2020 to 3.8 thousand USD in 2025, followed by Massachusetts, which grows from 3.0 thousand USD to 3.6 thousand USD. Connecticut rises from 2.9 thousand USD to 3.4 thousand USD, and New Jersey moves from 2.8 thousand USD to 3.3 thousand USD. California steadily climbs from 2.7 thousand USD to 3.2 thousand USD, reflecting strong economic activity. Illinois grows from 2.6 thousand USD to 3.1 thousand USD, while Maryland advances from 2.5 thousand USD to 3.0 thousand USD. Washington, Minnesota, and Oregon also exhibit moderate but consistent increases, ending at 2.9 thousand, 2.8 thousand, and 2.7 thousand USD respectively by 2025. This overall growth highlights the states’ strong tax bases and economic resilience.
| Labels | 2020 (USD thousands) | 2021 (USD thousands) | 2022 (USD thousands) | 2023 (USD thousands) | 2024 (Projected, USD thousands) | 2025 (Projected, USD thousands) |
|---|---|---|---|---|---|---|
| New York | 3.2 | 3.4 | 3.5 | 3.6 | 3.7 | 3.8 |
| Massachusetts | 3.0 | 3.1 | 3.2 | 3.3 | 3.5 | 3.6 |
| Connecticut | 2.9 | 3.0 | 3.1 | 3.2 | 3.3 | 3.4 |
| New Jersey | 2.8 | 2.9 | 3.0 | 3.1 | 3.2 | 3.3 |
| California | 2.7 | 2.8 | 2.9 | 3.0 | 3.1 | 3.2 |
| Illinois | 2.6 | 2.7 | 2.8 | 2.9 | 3.0 | 3.1 |
| Maryland | 2.5 | 2.6 | 2.7 | 2.8 | 2.9 | 3.0 |
| Washington | 2.4 | 2.5 | 2.6 | 2.7 | 2.8 | 2.9 |
| Minnesota | 2.3 | 2.4 | 2.5 | 2.6 | 2.7 | 2.8 |
| Oregon | 2.2 | 2.3 | 2.4 | 2.5 | 2.6 | 2.7 |


