Free Top 20 U.S. States by Household Net Worth (2018–2025) Charts
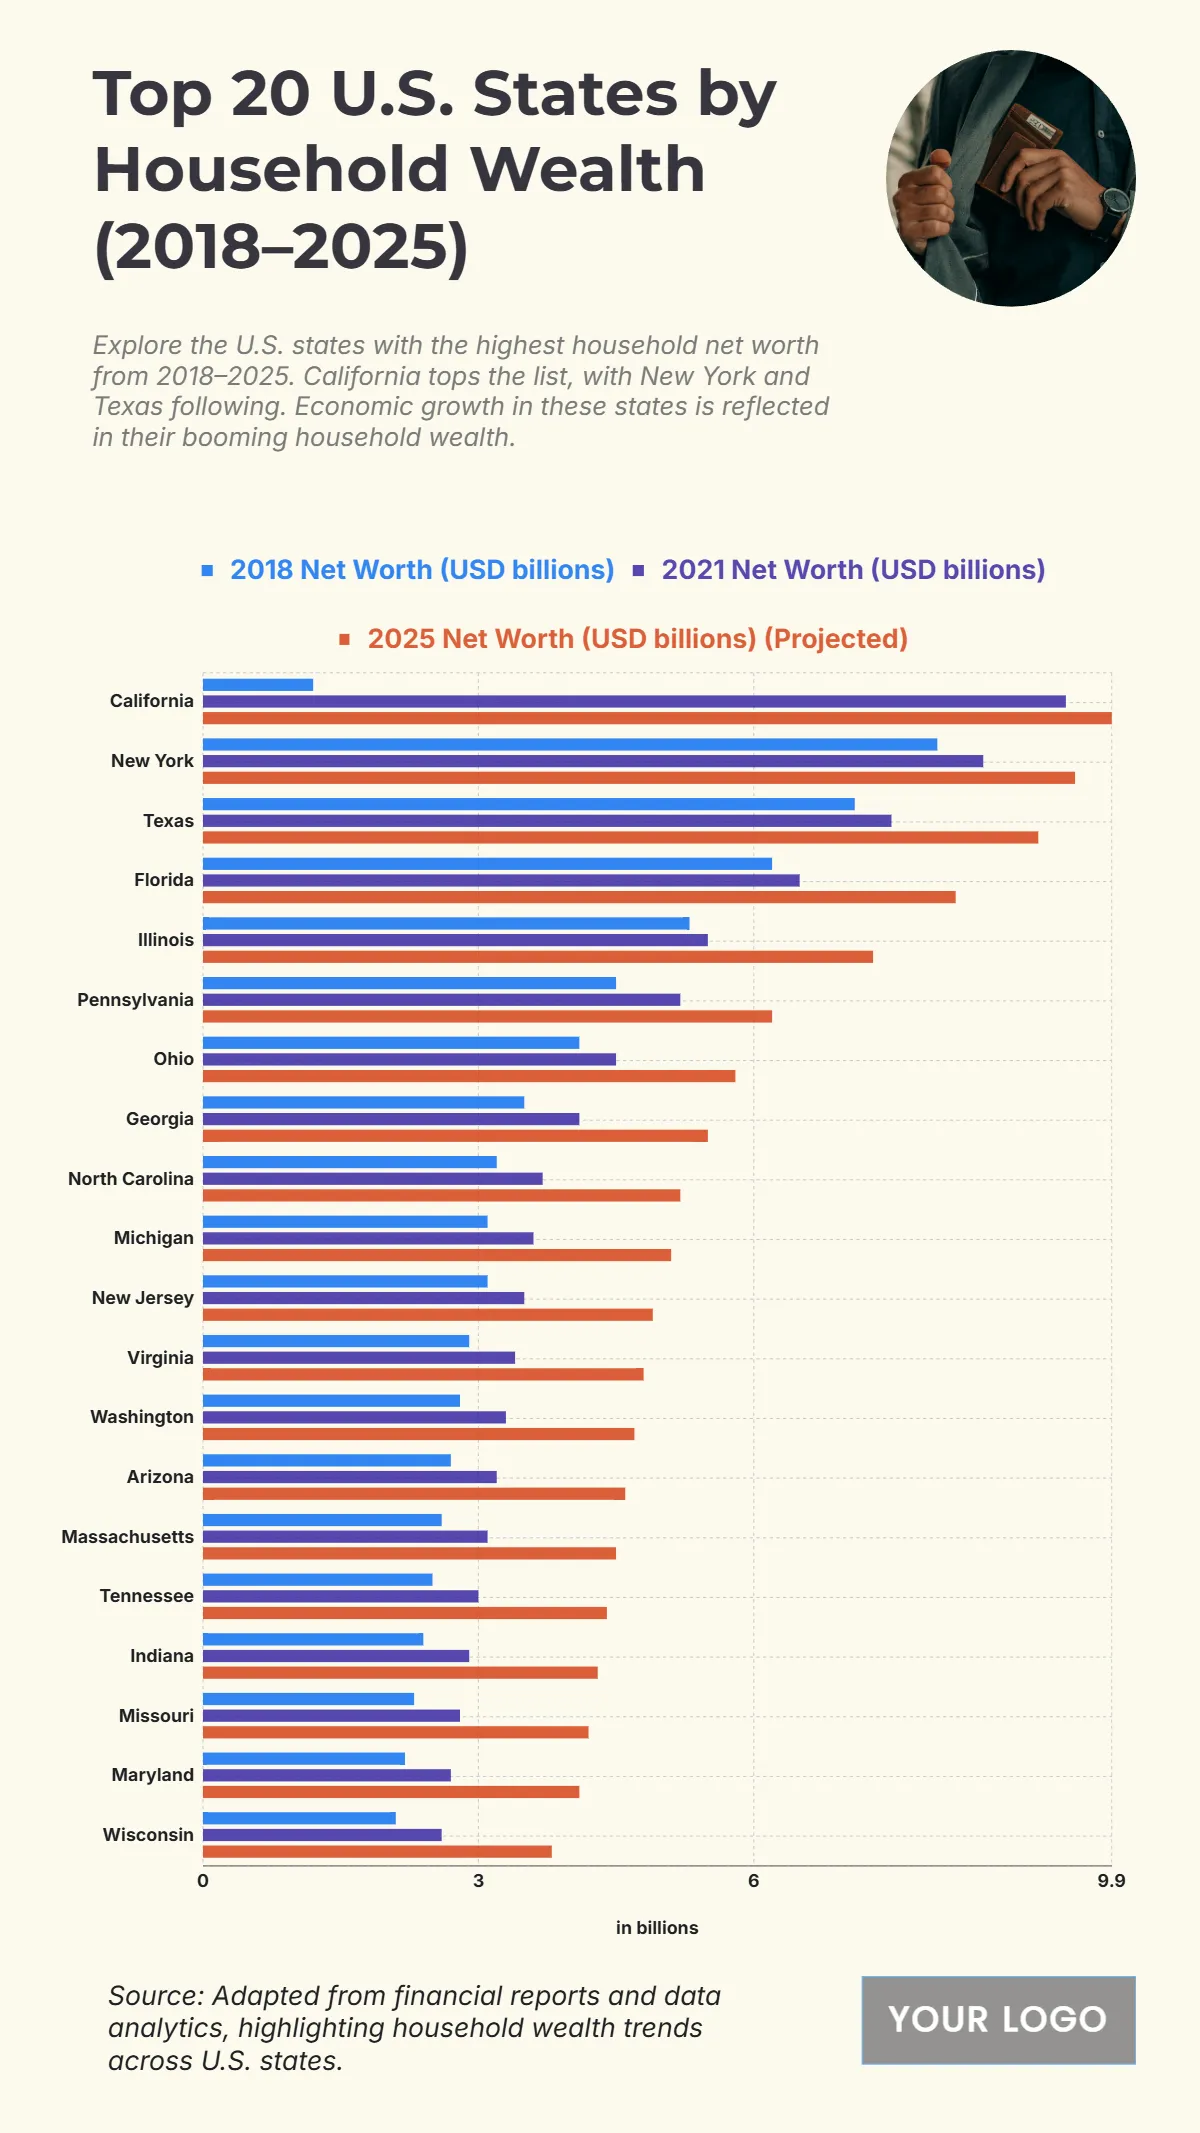
The chart highlights the growth of household wealth across the top 20 U.S. states from 2018 to 2025, showcasing significant economic expansion. California leads with household net worth increasing from $1.2 billion in 2018 to $9.9 billion projected in 2025, reflecting its strong economic base. New York follows closely, growing from $8 billion to $9.5 billion, while Texas climbs from $7.1 billion to $9.1 billion. Florida rises from $6.2 billion to $8.2 billion, and Illinois from $5.3 billion to $7.3 billion, highlighting robust financial growth. Pennsylvania, Ohio, and Georgia also see consistent increases, reaching $6.2 billion, $5.8 billion, and $5.5 billion respectively by 2025. Other states like North Carolina, Michigan, New Jersey, and Virginia display steady upward trends, reflecting expanding economic prosperity across multiple regions.
| Labels | 2018 Net Worth (USD billions) | 2021 Net Worth (USD billions) | 2025 Net Worth (USD billions) (Projected) |
|---|---|---|---|
| California | 1.2 | 9.4 | 9.9 |
| New York | 8 | 8.8 | 9.5 |
| Texas | 7.1 | 7.5 | 9.1 |
| Florida | 6.2 | 6.5 | 8.2 |
| Illinois | 5.3 | 5.5 | 7.3 |
| Pennsylvania | 4.5 | 5.2 | 6.2 |
| Ohio | 4.1 | 4.5 | 5.8 |
| Georgia | 3.5 | 4.1 | 5.5 |
| North Carolina | 3.2 | 3.7 | 5.2 |
| Michigan | 3.1 | 3.6 | 5 |
| New Jersey | 3.1 | 3.5 | 4.9 |
| Virginia | 2.9 | 3.4 | 4.8 |
| Washington | 2.8 | 3.3 | 4.7 |
| Arizona | 2.7 | 3.2 | 4.6 |
| Massachusetts | 2.6 | 3.1 | 4.5 |
| Tennessee | 2.5 | 3 | 4.3 |
| Indiana | 2.4 | 2.9 | 4.2 |
| Missouri | 2.3 | 2.8 | 4.1 |
| Maryland | 2.2 | 2.7 | 4.1 |
| Wisconsin | 2.1 | 2.6 | 3.8 |


