Free Top 10 States by Automotive Industry Revenue (2018–2025) Charts
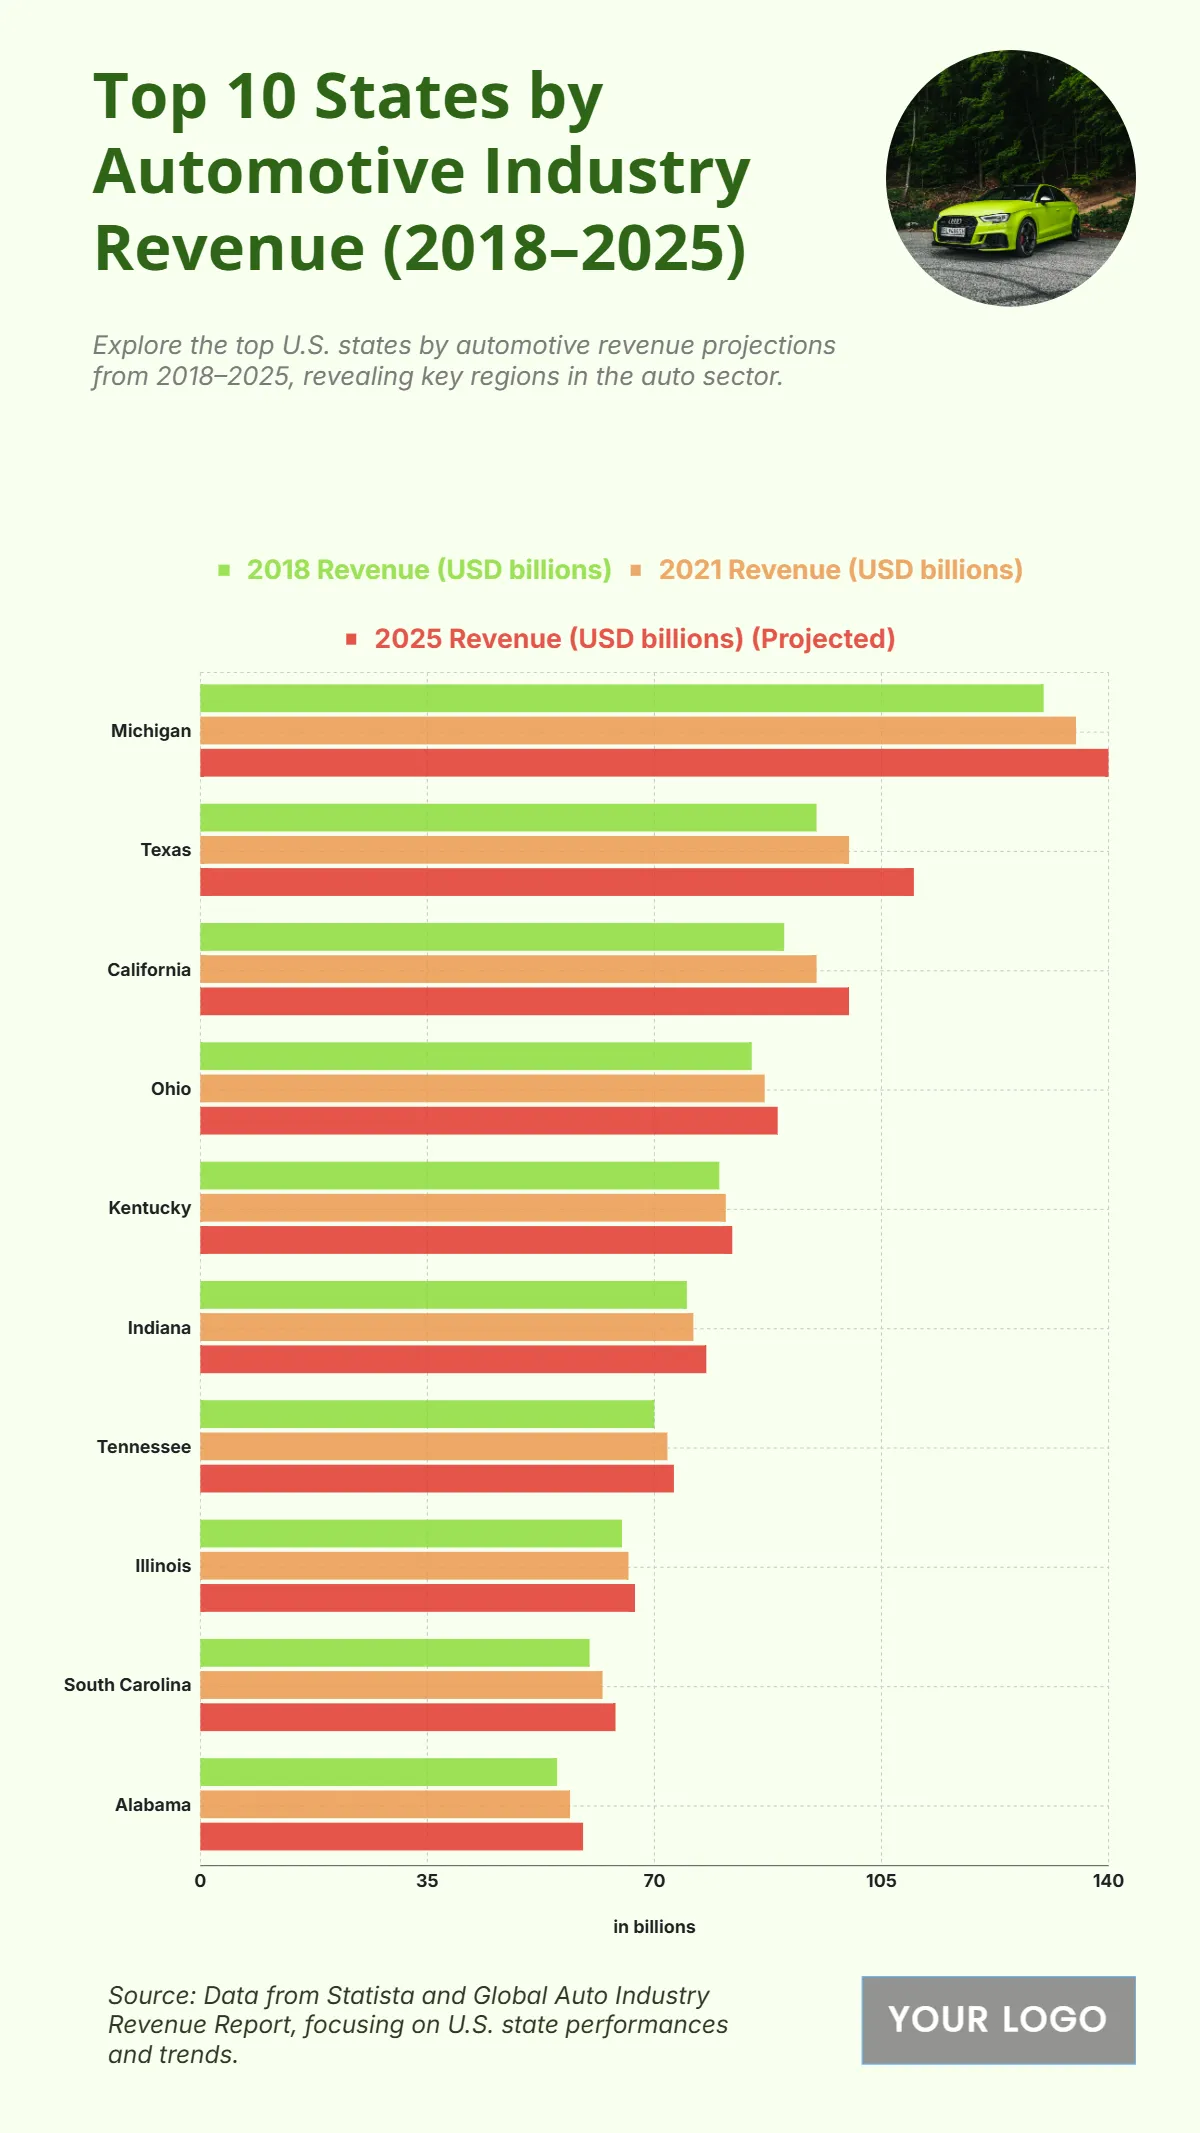
The chart highlights the upward trajectory of automotive industry revenue in the top U.S. states from 2018 to 2025, emphasizing key manufacturing hubs driving the sector’s growth. Michigan leads with a rise from $130 billion in 2018 to a projected $140 billion in 2025, cementing its status as the nation’s automotive capital. Texas follows, increasing from $95 billion to $110 billion, showing significant industrial expansion. California moves from $90 billion to $100 billion, reflecting the state’s growing role in tech-driven automotive advancements. Ohio records an increase from $85 billion to $89 billion, while Kentucky shows steady growth from $80 billion to $82 billion. Indiana, Tennessee, and Illinois also post moderate gains, reaching $78 billion, $73 billion, and $67 billion respectively by 2025. South Carolina and Alabama complete the top 10, climbing to $64 billion and $59 billion, highlighting their growing importance in automotive manufacturing and exports.
| Labels | 2018 Revenue (USD billions) | 2021 Revenue (USD billions) | 2025 Revenue (USD billions) (Projected) |
|---|---|---|---|
| Michigan | 130 | 135 | 140 |
| Texas | 95 | 100 | 110 |
| California | 90 | 95 | 100 |
| Ohio | 85 | 87 | 89 |
| Kentucky | 80 | 81 | 82 |
| Indiana | 75 | 76 | 78 |
| Tennessee | 70 | 72 | 73 |
| Illinois | 65 | 66 | 67 |
| South Carolina | 60 | 62 | 64 |
| Alabama | 55 | 57 | 59 |


