Free Top 10 U.S. States with the Highest State Government Employment (2018-2025) Chart
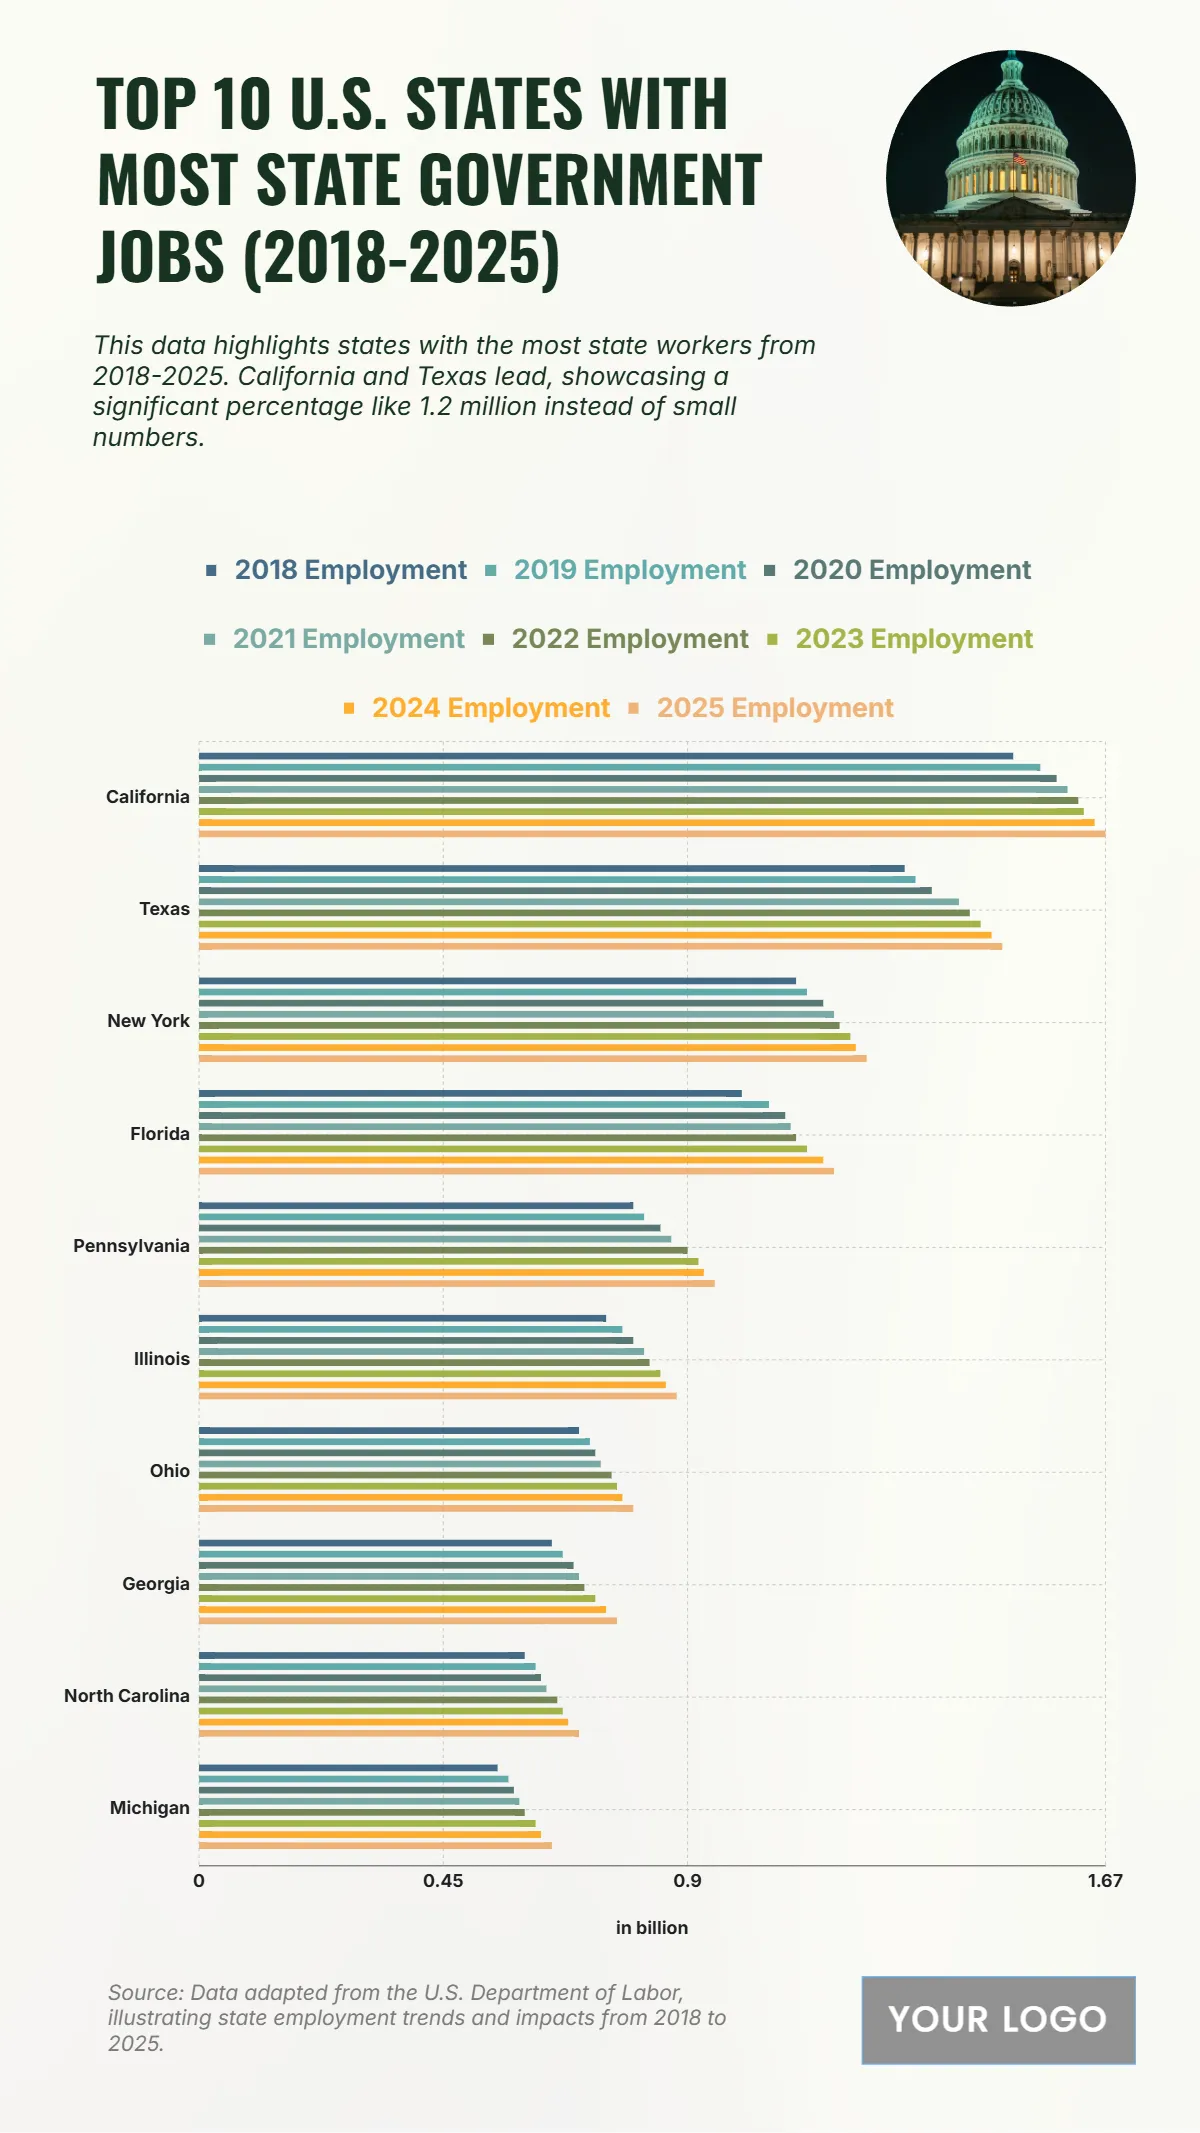
The chart displays the steady increase in state government employment across the top 10 U.S. states between 2018 and 2025, showing long-term growth in the public sector workforce. California consistently leads with 1.5 million jobs in 2018, climbing to 1.67 million by 2025, underscoring its significant role in government employment nationwide. Texas follows with 1.3 million employees in 2018 and 1.48 million in 2025, reflecting strong workforce expansion. New York grows from 1.1 million to 1.23 million, while Florida increases from 1 million to 1.17 million. Pennsylvania shows moderate but steady growth, moving from 0.8 million to 0.95 million. States like Illinois, Ohio, and Georgia reflect gradual increases, with Illinois rising from 0.75 million to 0.88 million. At the lower end, North Carolina and Michigan still demonstrate growth, with Michigan increasing from 0.55 million to 0.65 million by 2025. This trend highlights continuous employment expansion in state-level governance.
| Labels | 2018 | 2019 | 2020 | 2021 | 2022 | 2023 | 2024 | 2025 |
|---|---|---|---|---|---|---|---|---|
| California | 1.5 | 1.55 | 1.58 | 1.6 | 1.62 | 1.63 | 1.65 | 1.67 |
| Texas | 1.3 | 1.32 | 1.35 | 1.4 | 1.42 | 1.44 | 1.46 | 1.48 |
| New York | 1.1 | 1.12 | 1.15 | 1.17 | 1.18 | 1.2 | 1.21 | 1.23 |
| Florida | 1 | 1.05 | 1.08 | 1.09 | 1.1 | 1.12 | 1.15 | 1.17 |
| Pennsylvania | 0.8 | 0.82 | 0.85 | 0.87 | 0.9 | 0.92 | 0.93 | 0.95 |
| Illinois | 0.75 | 0.78 | 0.8 | 0.82 | 0.83 | 0.85 | 0.86 | 0.88 |
| Ohio | 0.7 | 0.72 | 0.73 | 0.74 | 0.76 | 0.77 | 0.78 | 0.8 |
| Georgia | 0.65 | 0.67 | 0.69 | 0.7 | 0.71 | 0.73 | 0.75 | 0.77 |
| North Carolina | 0.6 | 0.62 | 0.63 | 0.64 | 0.66 | 0.67 | 0.68 | 0.7 |
| Michigan | 0.55 | 0.57 | 0.58 | 0.59 | 0.6 | 0.62 | 0.63 | 0.65 |


