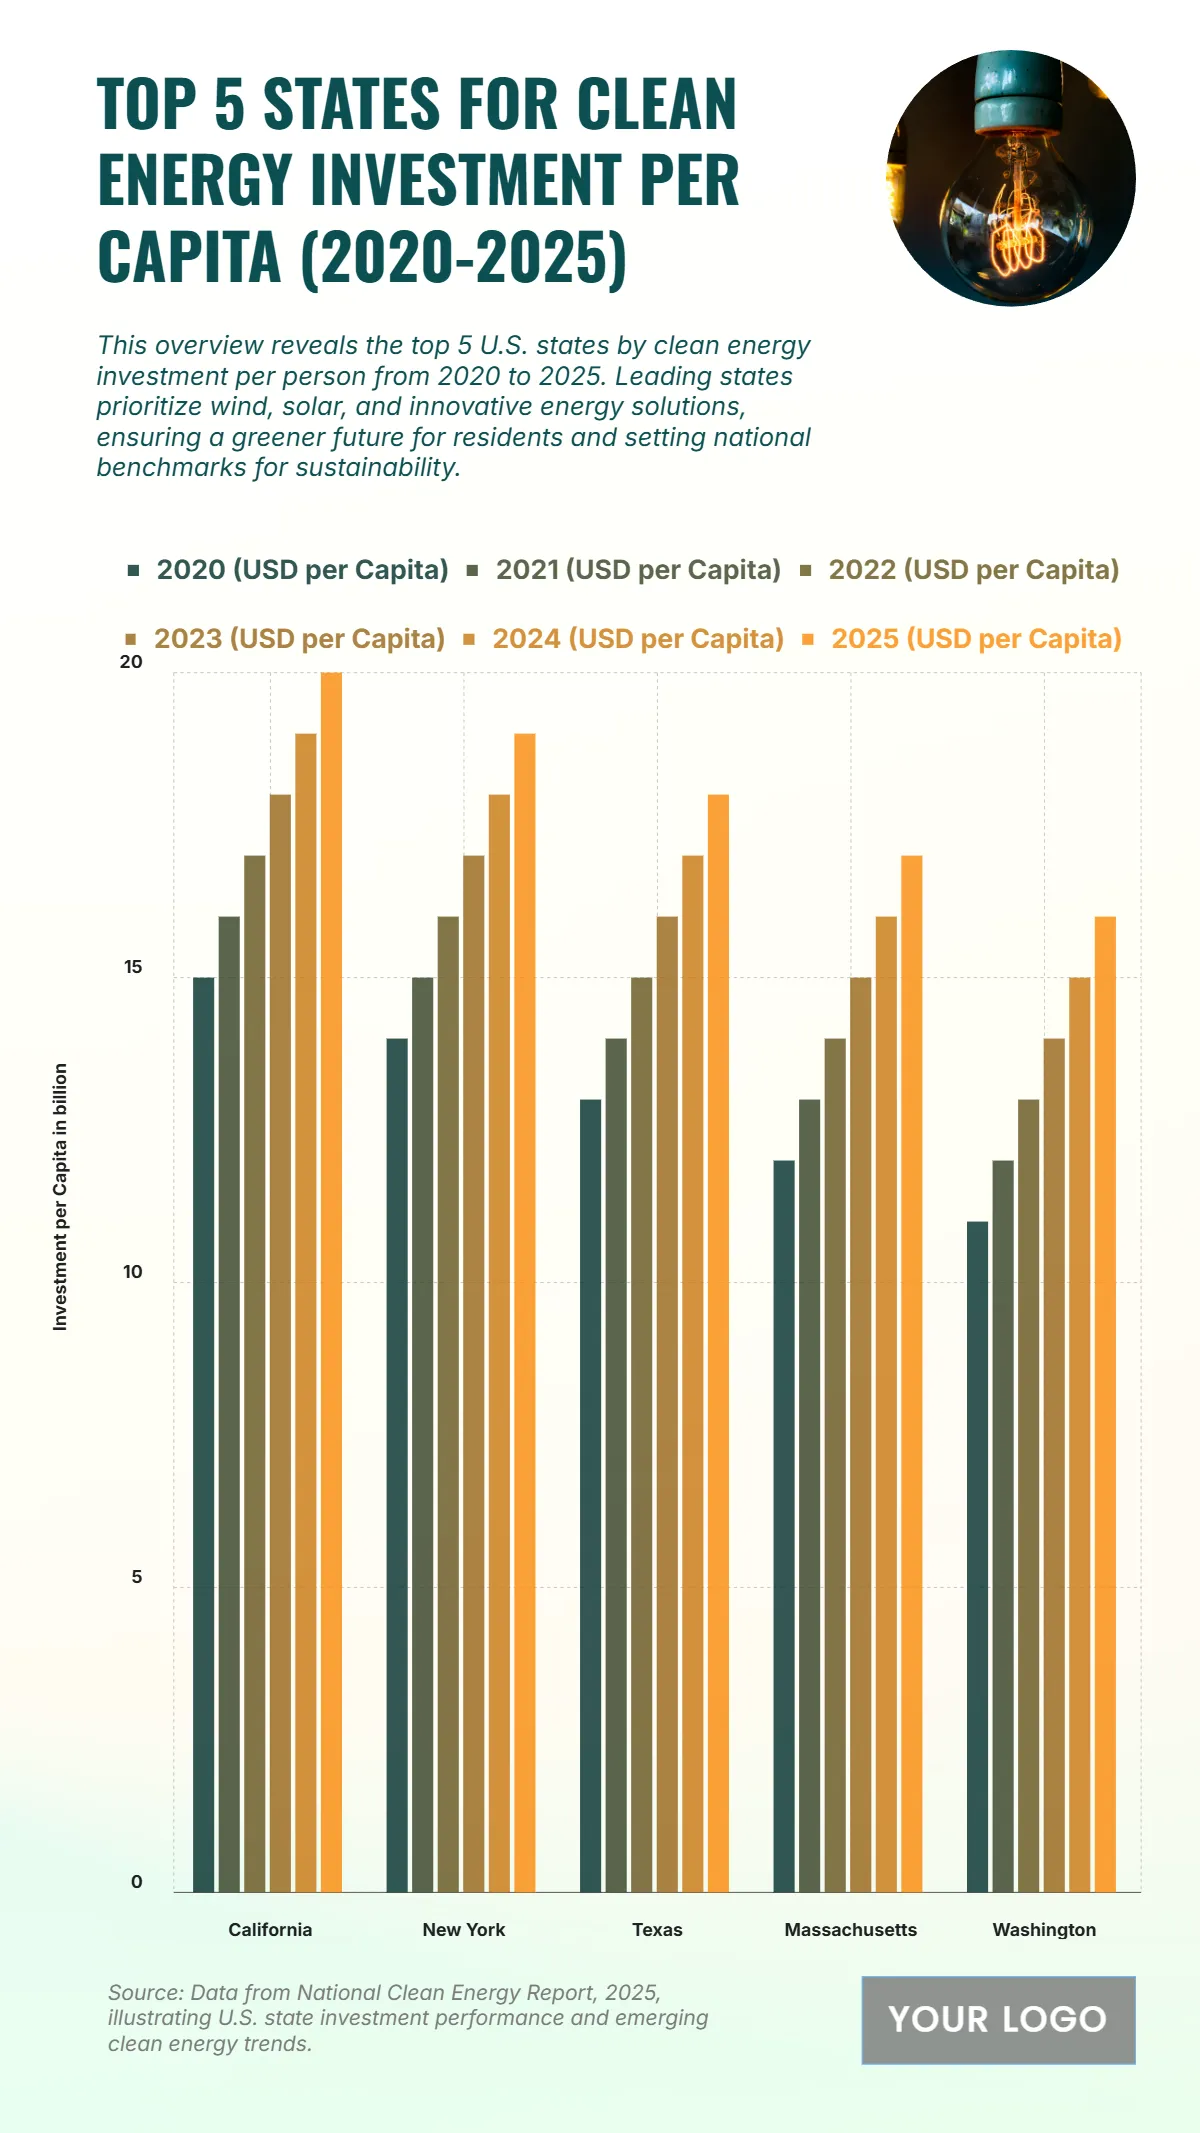
Free Top 5 U.S. States by Clean Energy Investment per Capita (2020-2025) Chart
The chart illustrates the steady rise of clean energy investment per capita across five leading U.S. states from 2020 to 2025, showcasing their growing commitment to renewable energy solutions. California leads consistently, starting at $15 per capita in 2020 and reaching $20 per capita by 2025, reflecting large-scale solar and wind energy expansion. New York follows with an increase from $14 to $19, highlighting significant green policy implementation. Texas, known for its wind energy capacity, grows from $13 to $18, demonstrating diversification in its energy mix. Massachusetts rises from $12 to $17, emphasizing innovative clean tech adoption, while Washington increases from $11 to $16, driven by hydropower and sustainability initiatives. The data indicates a consistent upward trend in renewable energy funding across these states, underlining their role as frontrunners in national clean energy development and environmental impact reduction.
| Labels | 2020 (USD per Capita) | 2021 (USD per Capita) | 2022 (USD per Capita) | 2023 (USD per Capita) | 2024 (USD per Capita) | 2025 (USD per Capita) |
|---|---|---|---|---|---|---|
| California | 15 | 16 | 17 | 18 | 19 | 20 |
| New York | 14 | 15 | 16 | 17 | 18 | 19 |
| Texas | 13 | 14 | 15 | 16 | 17 | 18 |
| Massachusetts | 12 | 13 | 14 | 15 | 16 | 17 |
| Washington | 11 | 12 | 13 | 14 | 15 | 16 |


