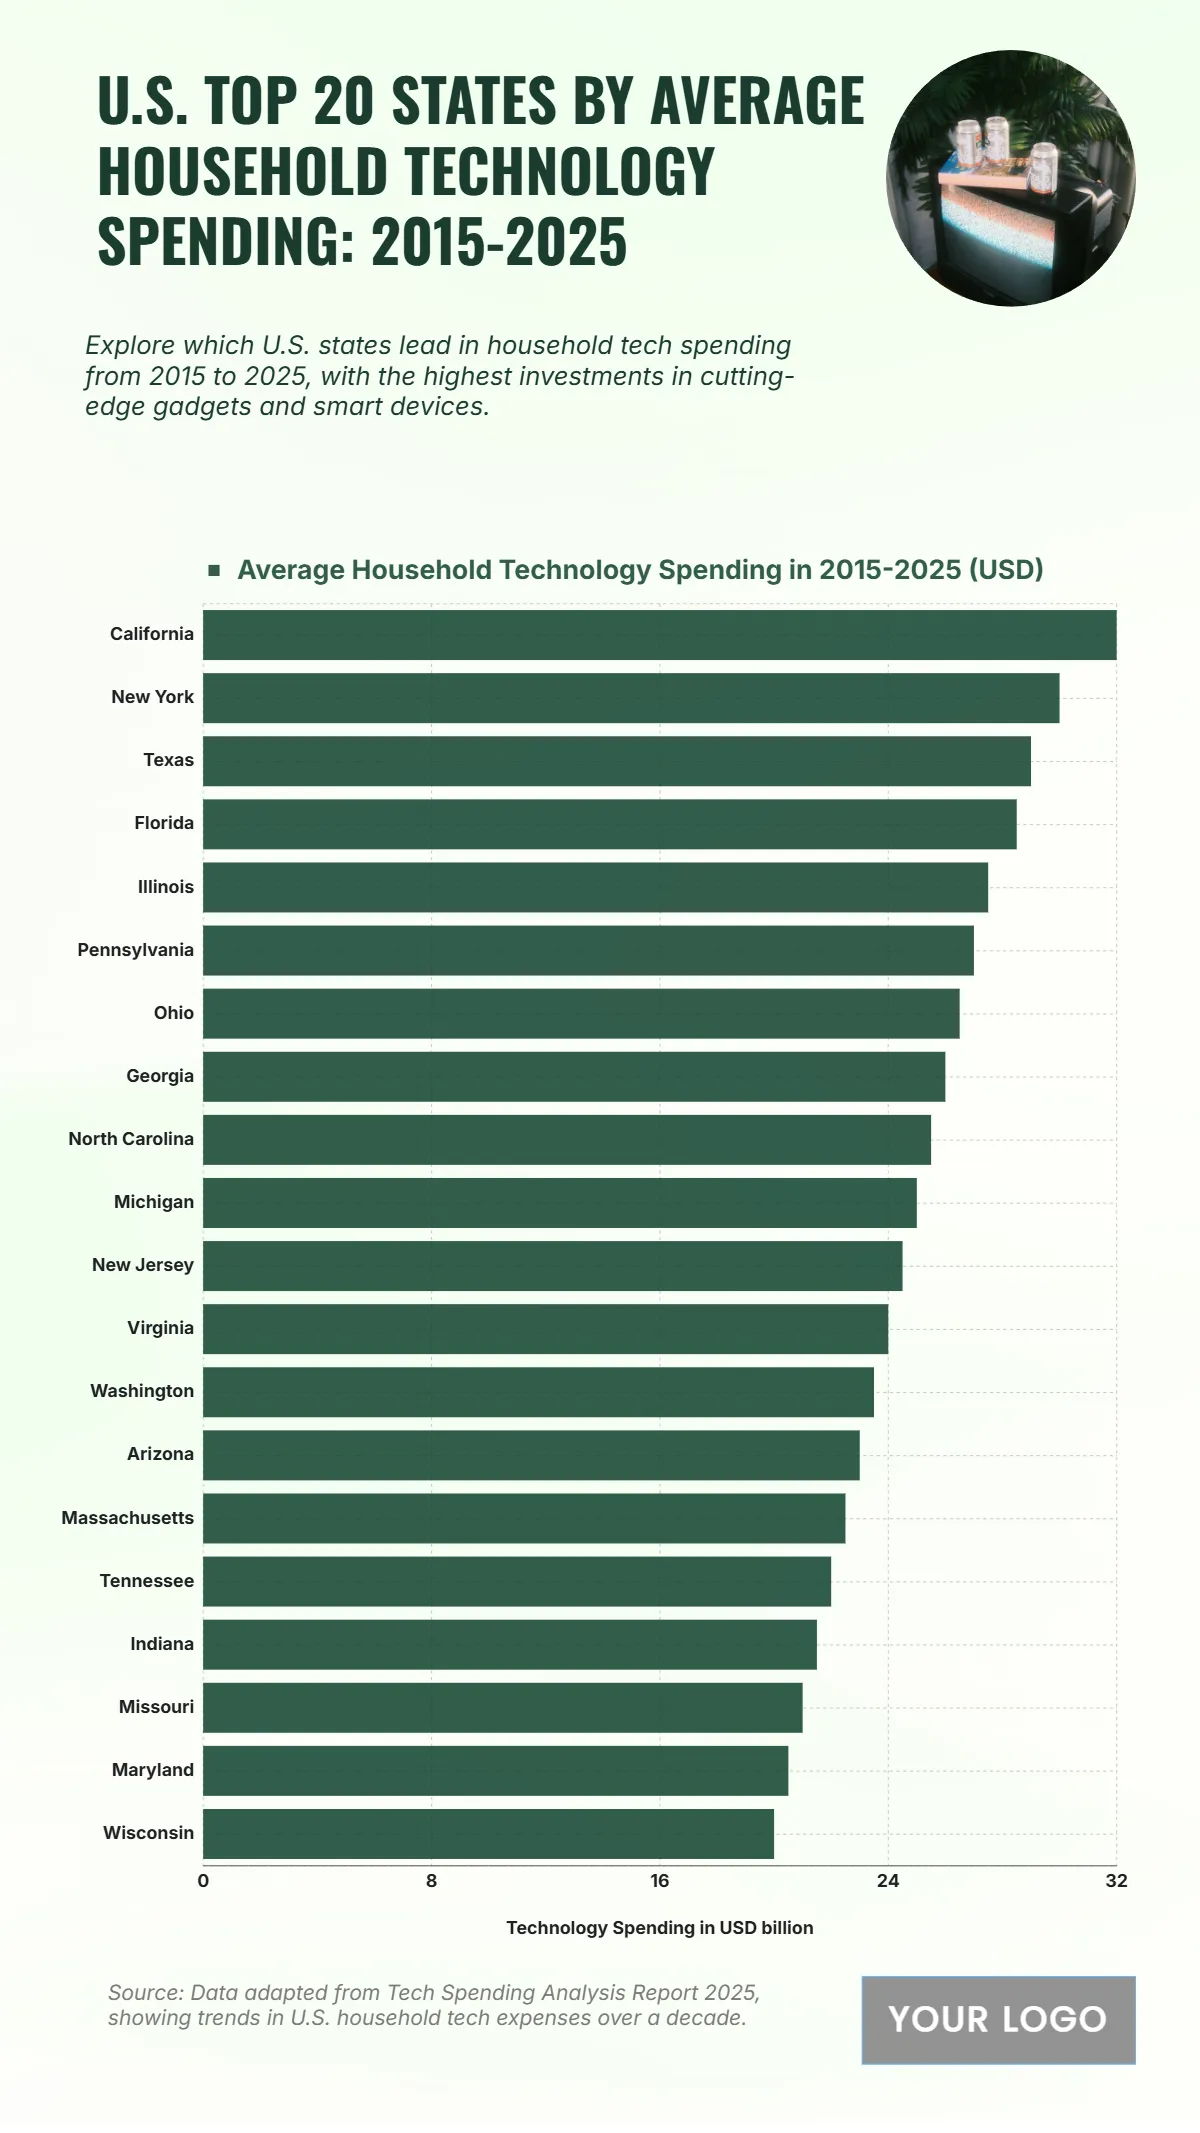
Free U.S. Top 20 States by Average Household Technology Spending (2015-2025) Chart
The chart shows how household technology spending across 20 U.S. states has surged from 2015 to 2025, reflecting rising investment in digital infrastructure and consumer tech. California leads with an average household spending of $32 billion, demonstrating its dominance as a tech hub. New York follows closely at $30 billion, while Texas ranks third with $29 billion. Florida shows strong consumer engagement at $28.5 billion, and Illinois records $27.5 billion. Pennsylvania and Ohio maintain solid spending levels of $27 billion and $26.5 billion respectively. States like Georgia, North Carolina, and Michigan range from $25 to $26 billion, signaling growing regional tech adoption. New Jersey and Virginia also stand out at $24.5 and $24 billion. The lower end includes Wisconsin at $20 billion, with Maryland and Missouri just above it. The data illustrates how widespread and consistent household investment in technology has become over the decade.
| Labels | Average Household Technology Spending in 2015–2025 (USD) |
|---|---|
| California | 32 |
| New York | 30 |
| Texas | 29 |
| Florida | 28.5 |
| Illinois | 27.5 |
| Pennsylvania | 27 |
| Ohio | 26.5 |
| Georgia | 26 |
| North Carolina | 25.5 |
| Michigan | 25 |
| New Jersey | 24.5 |
| Virginia | 24 |
| Washington | 23.5 |
| Arizona | 23 |
| Massachusetts | 22.5 |
| Tennessee | 22 |
| Indiana | 21.5 |
| Missouri | 21 |
| Maryland | 20.5 |
| Wisconsin | 20 |


