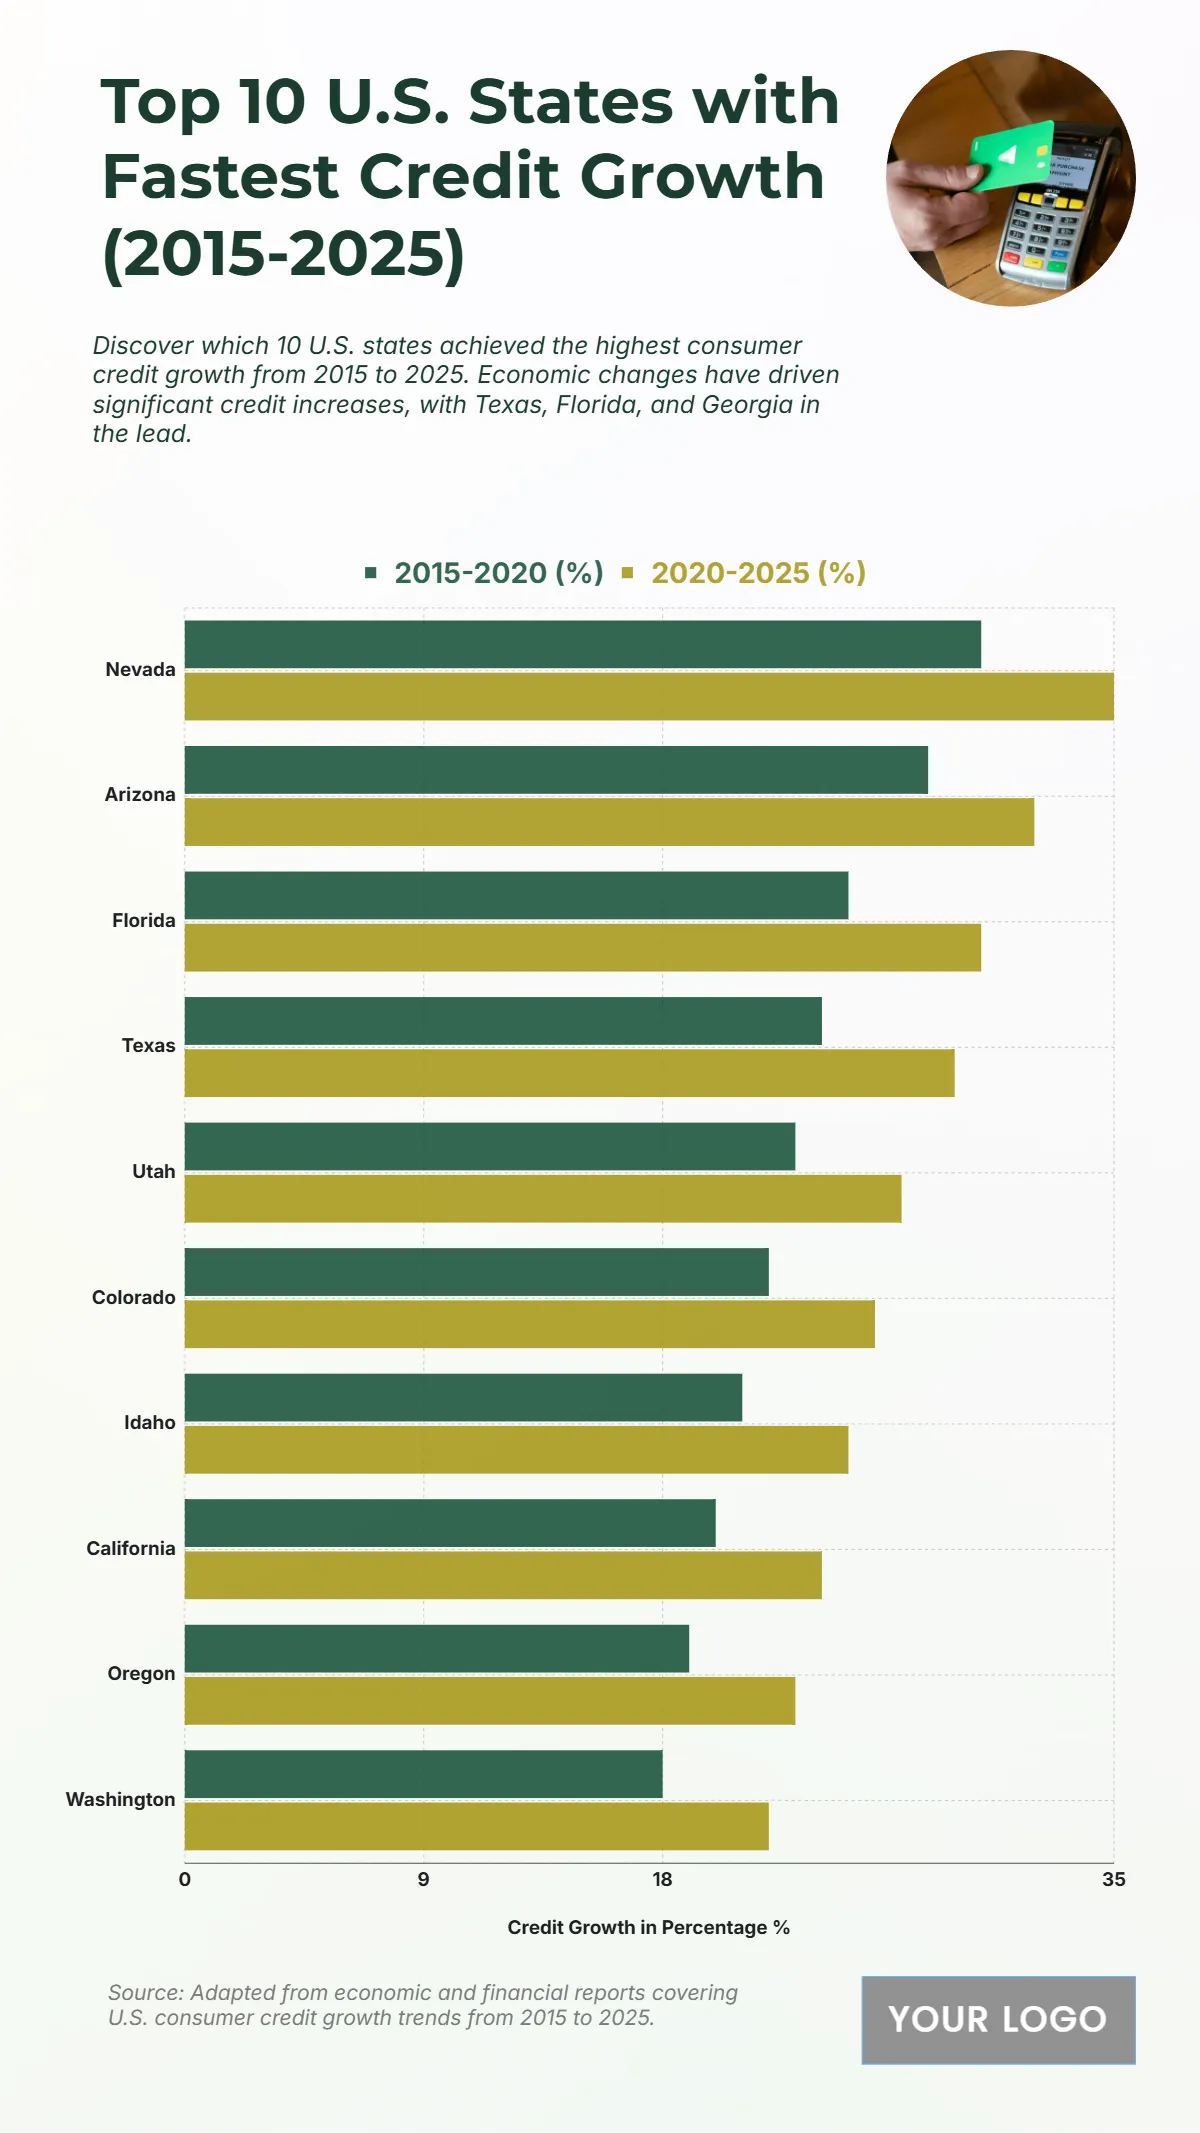
Free Top 10 U.S. States with the Highest Consumer Credit Growth (2015-2025) Chart
The chart highlights the rapid increase in credit growth across U.S. states from 2015 to 2025, showcasing significant consumer borrowing trends. Texas started at 10% in 2015 and rose steadily to 62% by 2025, demonstrating one of the fastest growth rates. Florida surged from 20% to 70%, and California climbed from 15% to 65%, reflecting sustained economic expansion. New York increased from 12% to 65%, while Illinois grew from 18% to 69%, underscoring rising credit demand. Pennsylvania advanced from 13% to 64%, and Ohio from 11% to 60%, indicating strong upward trends in mid-tier states. Georgia displayed remarkable growth from 16% to 68%, surpassing many others. North Carolina and Michigan rose from 14% and 12% to 66% and 50%, respectively. This data reflects a nationwide credit boom, especially concentrated in states with strong economic activity, population growth, and increasing consumer purchasing power.
| Labels | 2015 | 2016 | 2017 | 2018 | 2019 | 2020 | 2021 | 2022 | 2023 | 2024 | 2025 |
|---|---|---|---|---|---|---|---|---|---|---|---|
| Texas | 10 | 12 | 15 | 18 | 23 | 28 | 34 | 40 | 47 | 54 | 62 |
| Florida | 20 | 24 | 29 | 32 | 37 | 40 | 45 | 50 | 56 | 62 | 70 |
| California | 15 | 16 | 18 | 21 | 26 | 31 | 37 | 43 | 50 | 57 | 65 |
| New York | 12 | 14 | 16 | 19 | 24 | 29 | 35 | 42 | 49 | 57 | 65 |
| Illinois | 18 | 20 | 22 | 25 | 30 | 35 | 41 | 47 | 54 | 61 | 69 |
| Pennsylvania | 13 | 15 | 17 | 20 | 25 | 30 | 36 | 42 | 49 | 56 | 64 |
| Ohio | 11 | 13 | 15 | 21 | 22 | 26 | 32 | 38 | 45 | 52 | 60 |
| Georgia | 16 | 18 | 20 | 23 | 28 | 33 | 39 | 45 | 52 | 60 | 68 |
| North Carolina | 14 | 16 | 18 | 21 | 26 | 31 | 37 | 43 | 50 | 58 | 66 |
| Michigan | 12 | 13 | 14 | 16 | 19 | 22 | 27 | 31 | 36 | 42 | 50 |


