Free U.S. Top 10 States by Oil & Gas Production (2018–2025)
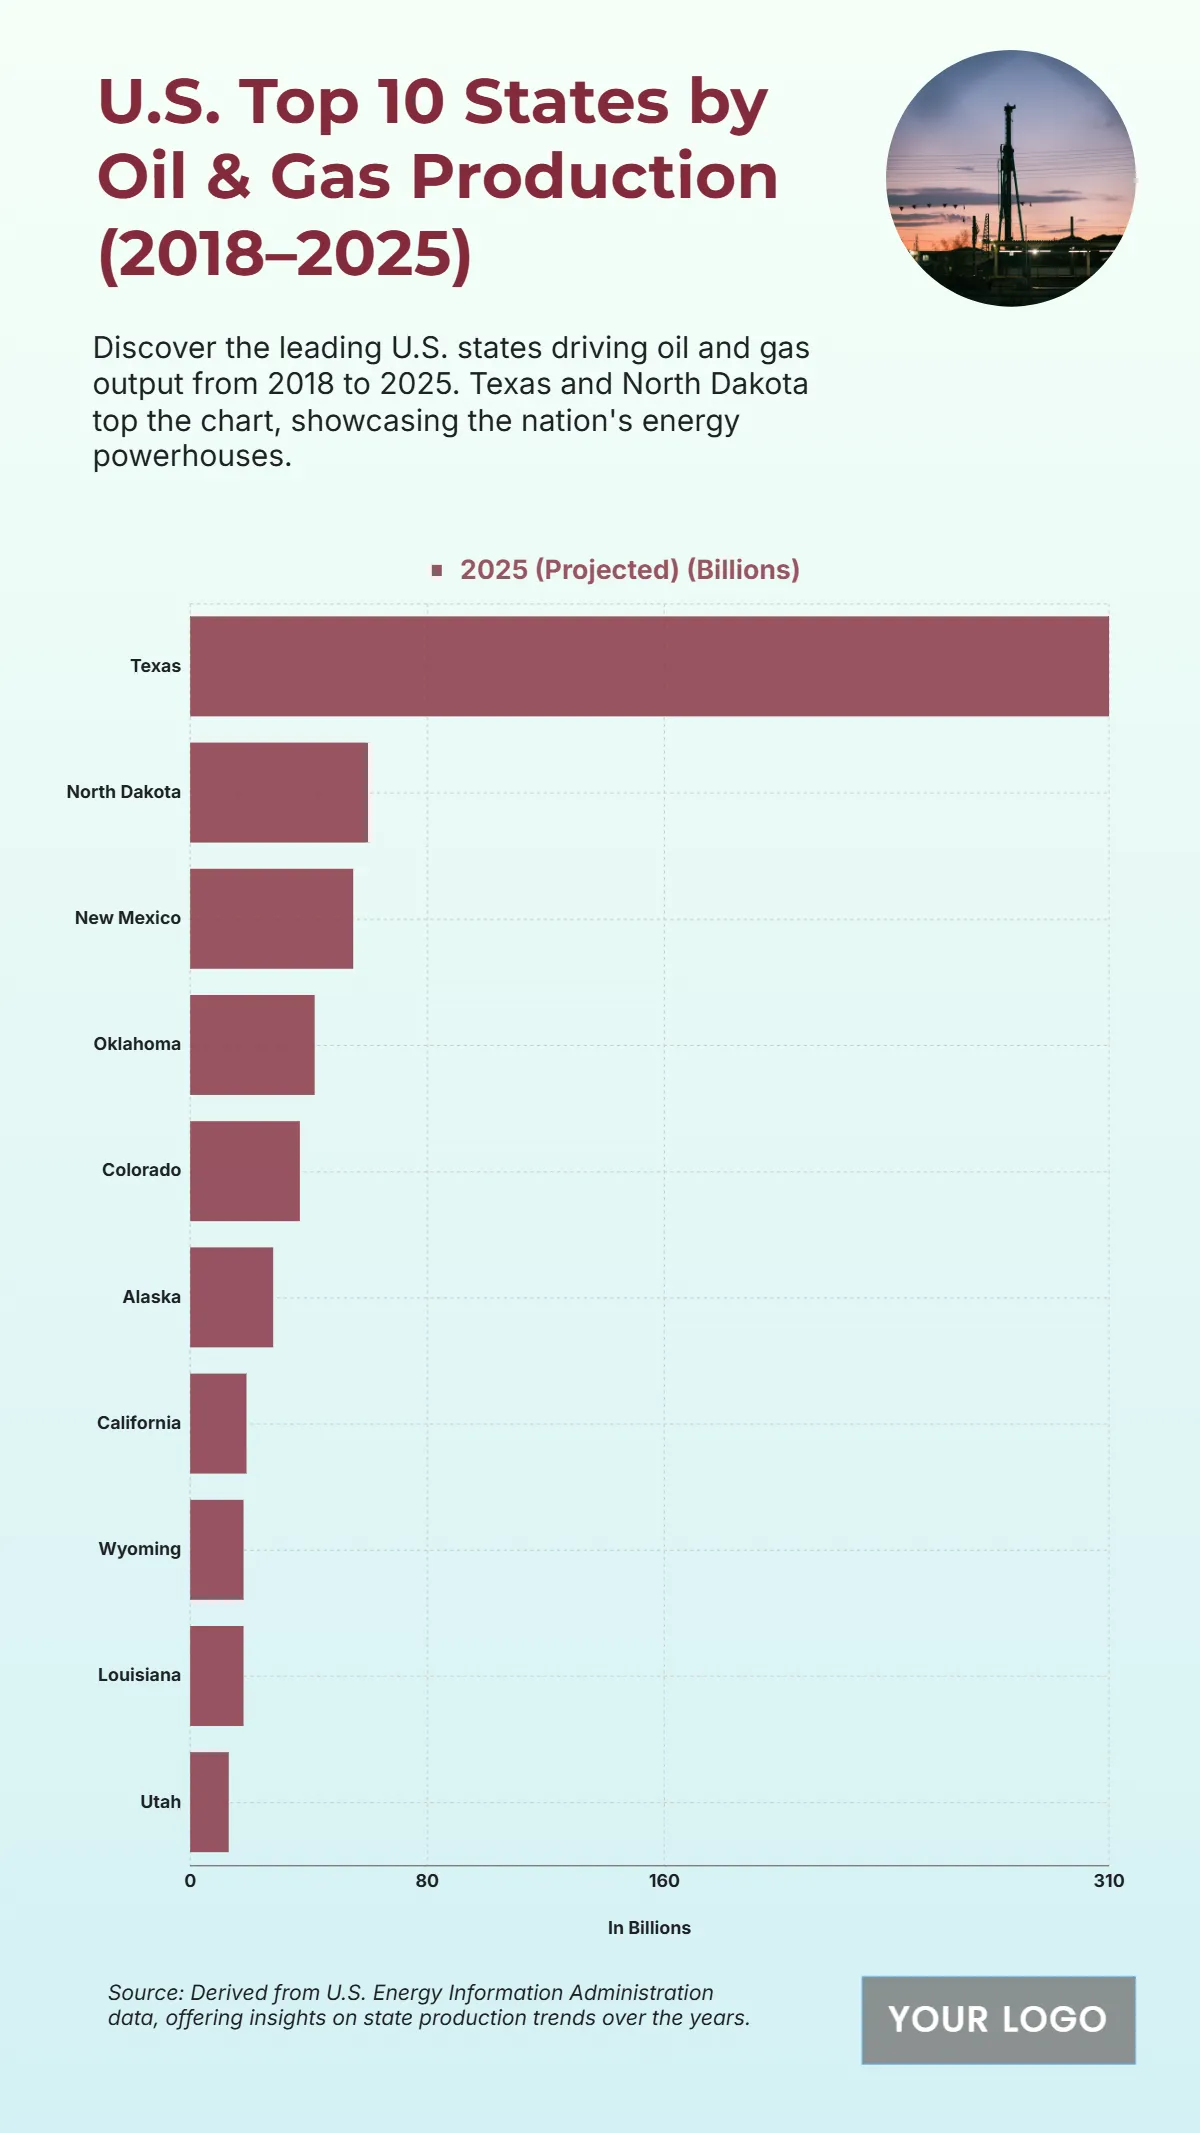
The chart emphasizes the projected dominance of key U.S. states in oil and gas production by 2025, with Texas standing far ahead of others at $310 billion, reflecting its pivotal role in the national energy sector. North Dakota follows at a distant $60 billion, while New Mexico reaches $55 billion, both underscoring their strong energy outputs. Oklahoma contributes $42 billion, and Colorado follows with $37 billion, showcasing solid mid-tier production levels. Smaller but still significant producers include Alaska at $28 billion, California at $19 billion, Wyoming and Louisiana each at $18 billion, and Utah with $13 billion. The wide gap between Texas and other states highlights the state’s unparalleled capacity in the industry, driven by its vast reserves and advanced infrastructure. These figures collectively outline the geographical concentration of U.S. oil and gas activity and its continuing economic impact.
| Labels | 2025 (Projected) (Billions) |
|---|---|
| Texas | 310 |
| North Dakota | 60 |
| New Mexico | 55 |
| Oklahoma | 42 |
| Colorado | 37 |
| Alaska | 28 |
| California | 19 |
| Wyoming | 18 |
| Louisiana | 18 |
| Utah | 13 |


