Free Top 20 U.S. States by Educational Spending per Capita (2020–2025) Charts
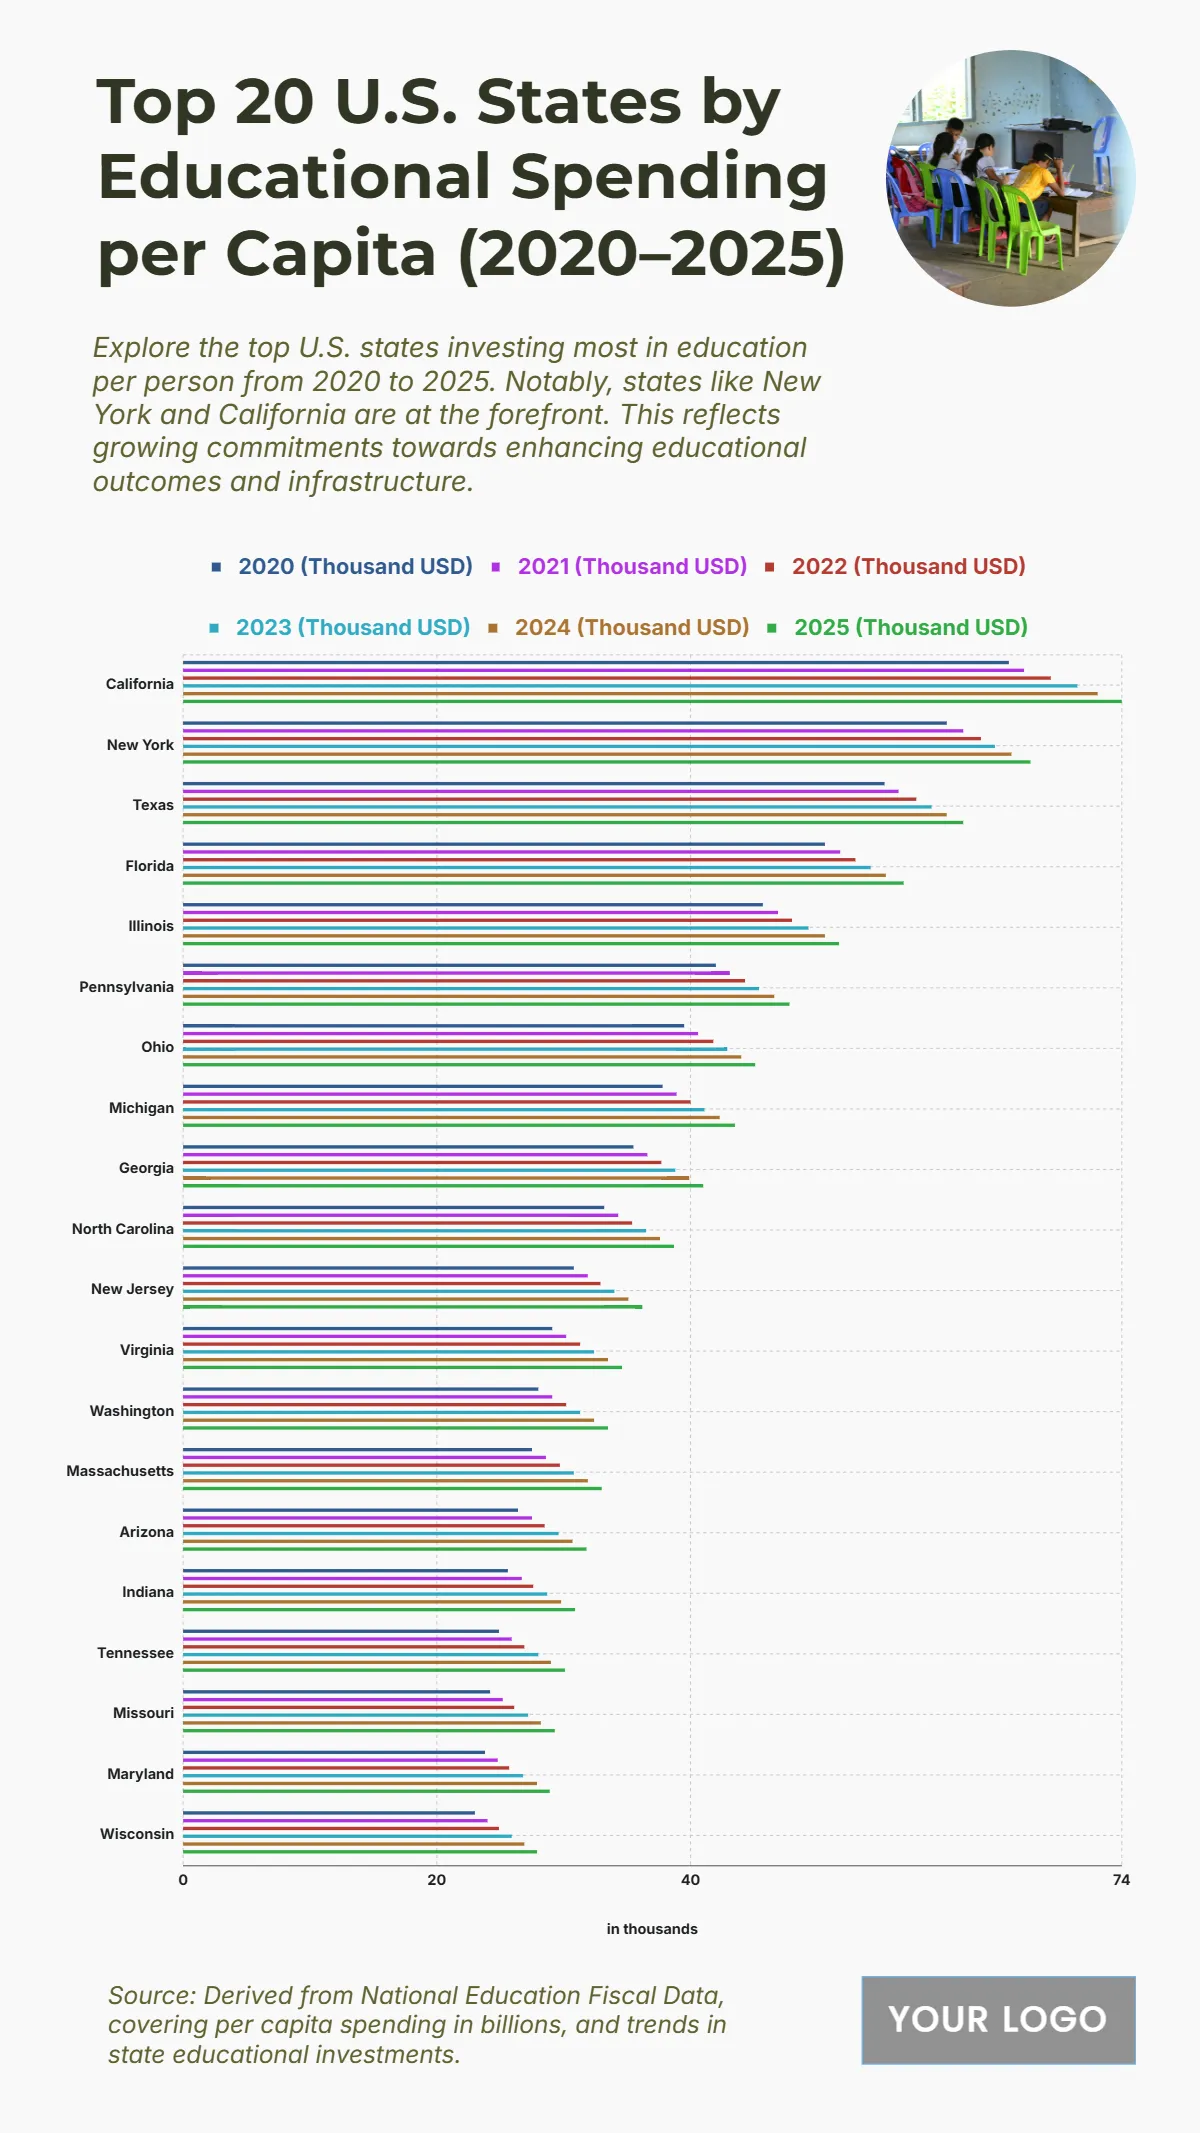
The chart illustrates the steady increase in educational spending per capita across the top 20 U.S. states from 2020 to 2025, highlighting states with the strongest commitments to educational investments. California leads significantly, rising from $65.1K in 2020 to $74K in 2025, showing consistent and robust funding growth. New York follows with an increase from $60.2K to $66.8K, while Texas climbs from $55.3K to $61.5K over the same period. Florida and Illinois grow to $56.8K and $51.7K respectively, reflecting strong allocations for education. Mid-ranking states like Pennsylvania, Ohio, Michigan, and Georgia show moderate but steady increases, reaching $47.8K, $45.1K, $43.5K, and $41K respectively by 2025. Lower-ranking states such as Maryland and Wisconsin still show upward movement, hitting $28.9K and $27.9K, indicating overall national growth trends in educational investment.
| Labels | 2020 (Thousand USD) | 2021 (Thousand USD) | 2022 (Thousand USD) | 2023 (Thousand USD) | 2024 (Thousand USD) | 2025 (Thousand USD) |
|---|---|---|---|---|---|---|
| California | 65.1 | 66.3 | 68.4 | 70.5 | 72.1 | 74 |
| New York | 60.2 | 61.5 | 62.9 | 64.8 | 65.3 | 66.8 |
| Texas | 55.3 | 56.4 | 57.8 | 59 | 60.2 | 61.5 |
| Florida | 50.6 | 51.8 | 53 | 54.2 | 55.4 | 56.8 |
| Illinois | 45.7 | 46.9 | 48 | 49.3 | 50.6 | 51.7 |
| Pennsylvania | 42 | 43.1 | 44.3 | 45.8 | 46.6 | 47.8 |
| Ohio | 39.5 | 40.6 | 41.8 | 42.9 | 44 | 45.1 |
| Michigan | 37.8 | 38.9 | 40 | 41.1 | 42.3 | 43.5 |
| Georgia | 35.5 | 36.6 | 37.7 | 38.8 | 39.9 | 41 |
| North Carolina | 33.2 | 34.3 | 35.4 | 36.3 | 37.6 | 38.7 |
| New Jersey | 30.8 | 31.9 | 32.9 | 33.9 | 35.1 | 36.2 |
| Virginia | 29.1 | 30.2 | 31.3 | 32.4 | 33.5 | 34.6 |
| Washington | 28 | 29.1 | 30.2 | 31.3 | 32.4 | 33.5 |
| Massachusetts | 27.5 | 28.6 | 29.5 | 30.7 | 31.9 | 33 |
| Arizona | 26.4 | 27.5 | 28.5 | 29.6 | 30.7 | 31.8 |
| Indiana | 25.6 | 26.7 | 27.6 | 28.7 | 29.8 | 30.9 |
| Tennessee | 24.9 | 25.9 | 26.9 | 28 | 29 | 30.1 |
| Missouri | 24.2 | 25.2 | 26.2 | 27.2 | 28.2 | 29.3 |
| Maryland | 23.8 | 24.8 | 25.7 | 26.8 | 27.9 | 28.9 |
| Wisconsin | 23 | 24 | 24.9 | 25.9 | 26.9 | 27.9 |


