Free Top 20 States by Corporate Tax Contributions (2018–2025) Charts
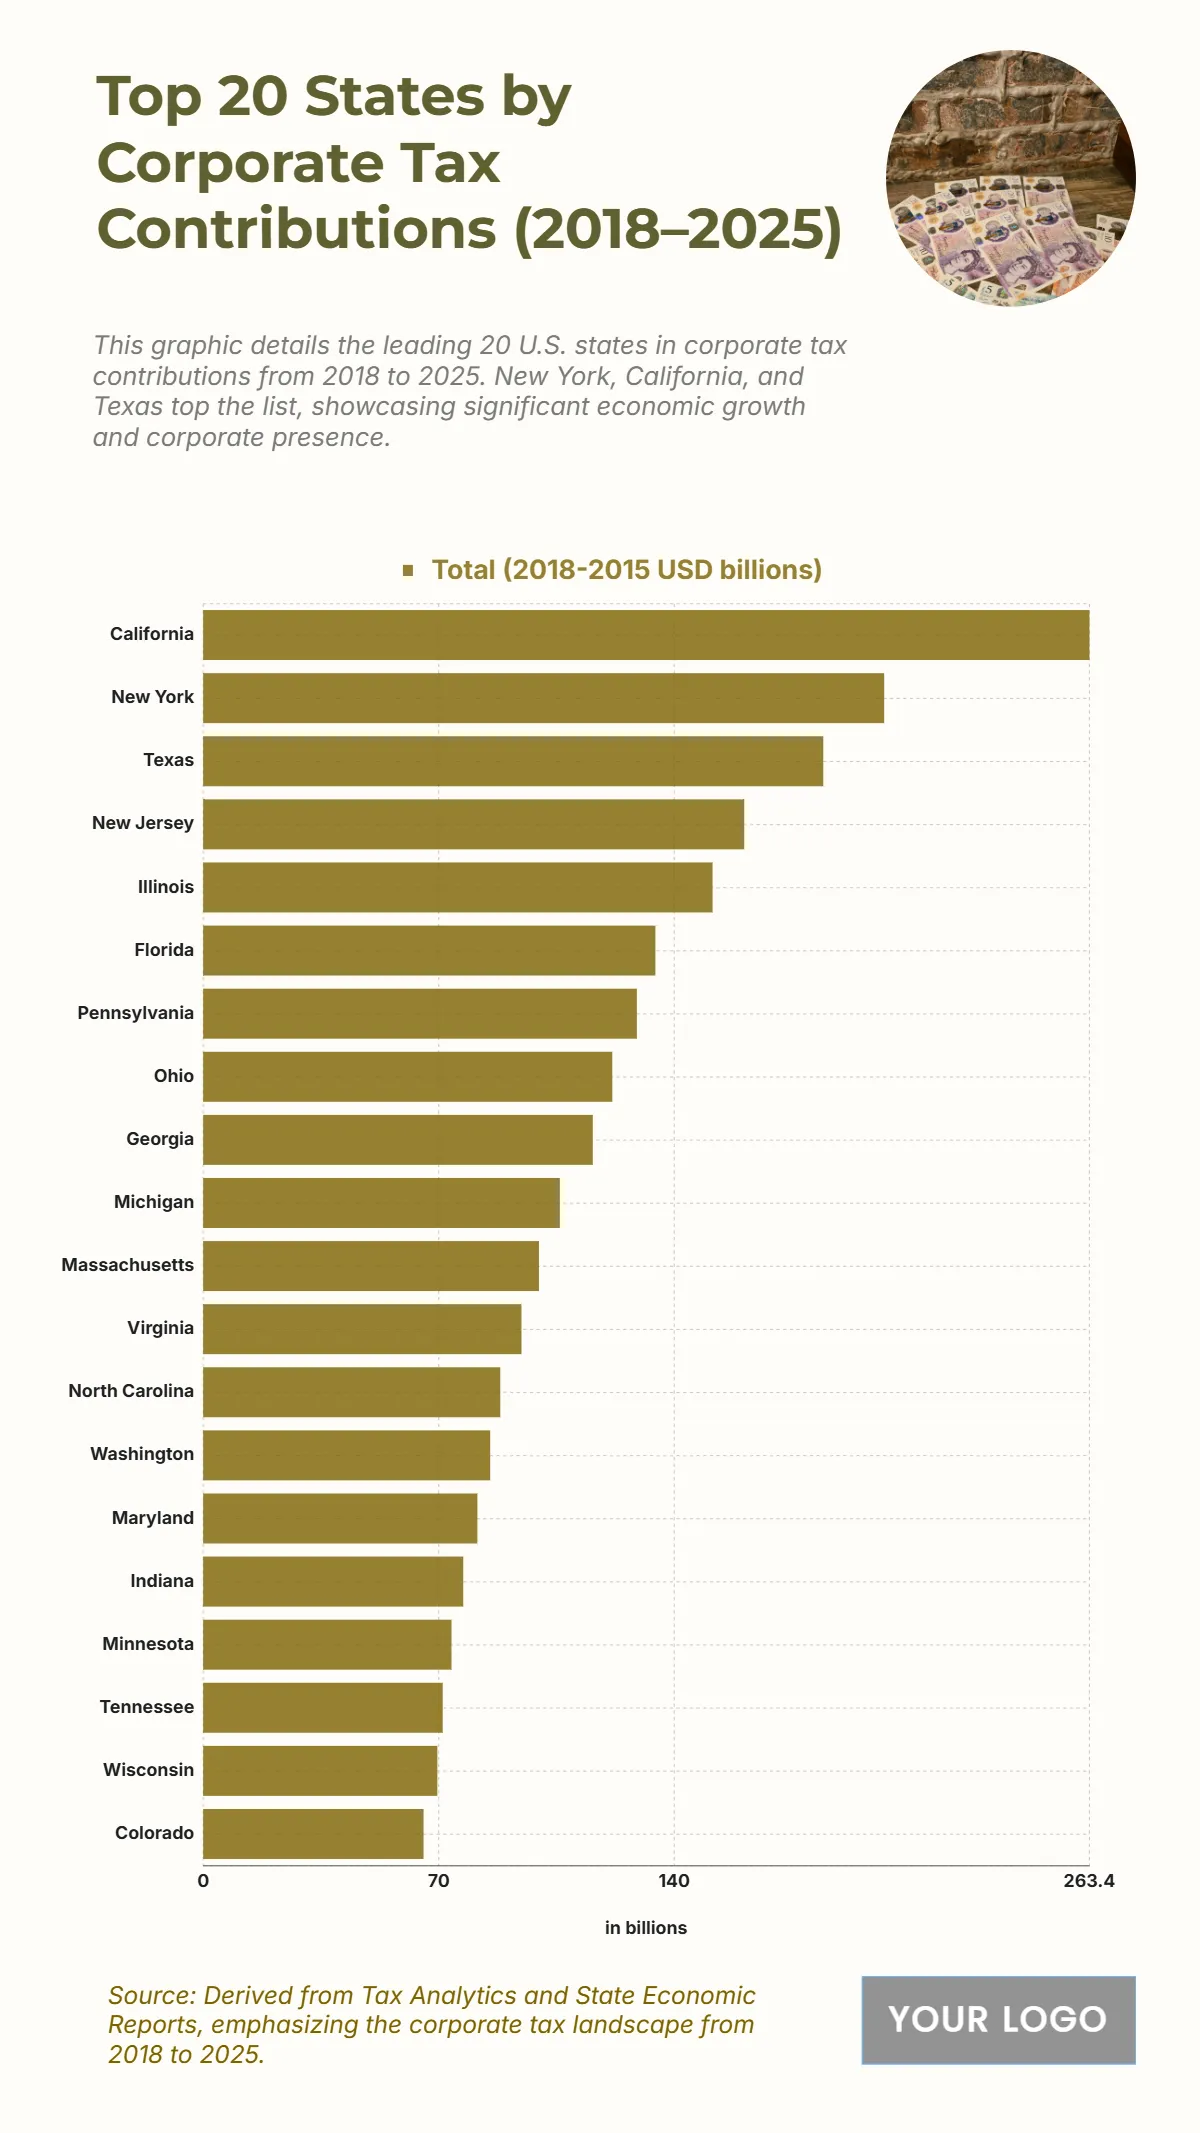
The chart shows the states contributing the most in corporate tax revenues between 2018 and 2025, highlighting the dominant role of top economic hubs. California leads with an impressive $263.4 billion, underscoring its strong corporate base and tax collection. New York follows with $202.4 billion, while Texas contributes $184.3 billion, showcasing their status as major business centers. New Jersey records $160.8 billion, and Illinois follows closely at $151.4 billion. Mid-tier contributors such as Florida with $134.4 billion, Pennsylvania with $128.9 billion, and Ohio with $121.6 billion reflect significant economic activity. Georgia, Michigan, and Massachusetts contribute between $115.8 billion and $99.8 billion, showing strong regional corporate presence. The lower portion of the top 20 includes states like Virginia, North Carolina, Washington, and Colorado, still contributing substantial revenues ranging from $94.6 billion down to $65.5 billion, illustrating a broad geographic spread of corporate tax strength.
| Labels | Total (2018–2025 USD billions) |
|---|---|
| California | 263.4 |
| New York | 202.4 |
| Texas | 184.3 |
| New Jersey | 160.8 |
| Illinois | 151.4 |
| Florida | 134.4 |
| Pennsylvania | 128.9 |
| Ohio | 121.6 |
| Georgia | 115.8 |
| Michigan | 106 |
| Massachusetts | 99.8 |
| Virginia | 94.6 |
| North Carolina | 88.3 |
| Washington | 85.3 |
| Maryland | 81.5 |
| Indiana | 77.3 |
| Minnesota | 73.8 |
| Tennessee | 71.2 |
| Wisconsin | 69.6 |
| Colorado | 65.5 |


