Free Top 10 U.S. States by Public Debt-to-Revenue Ratio (2018-2025) Chart
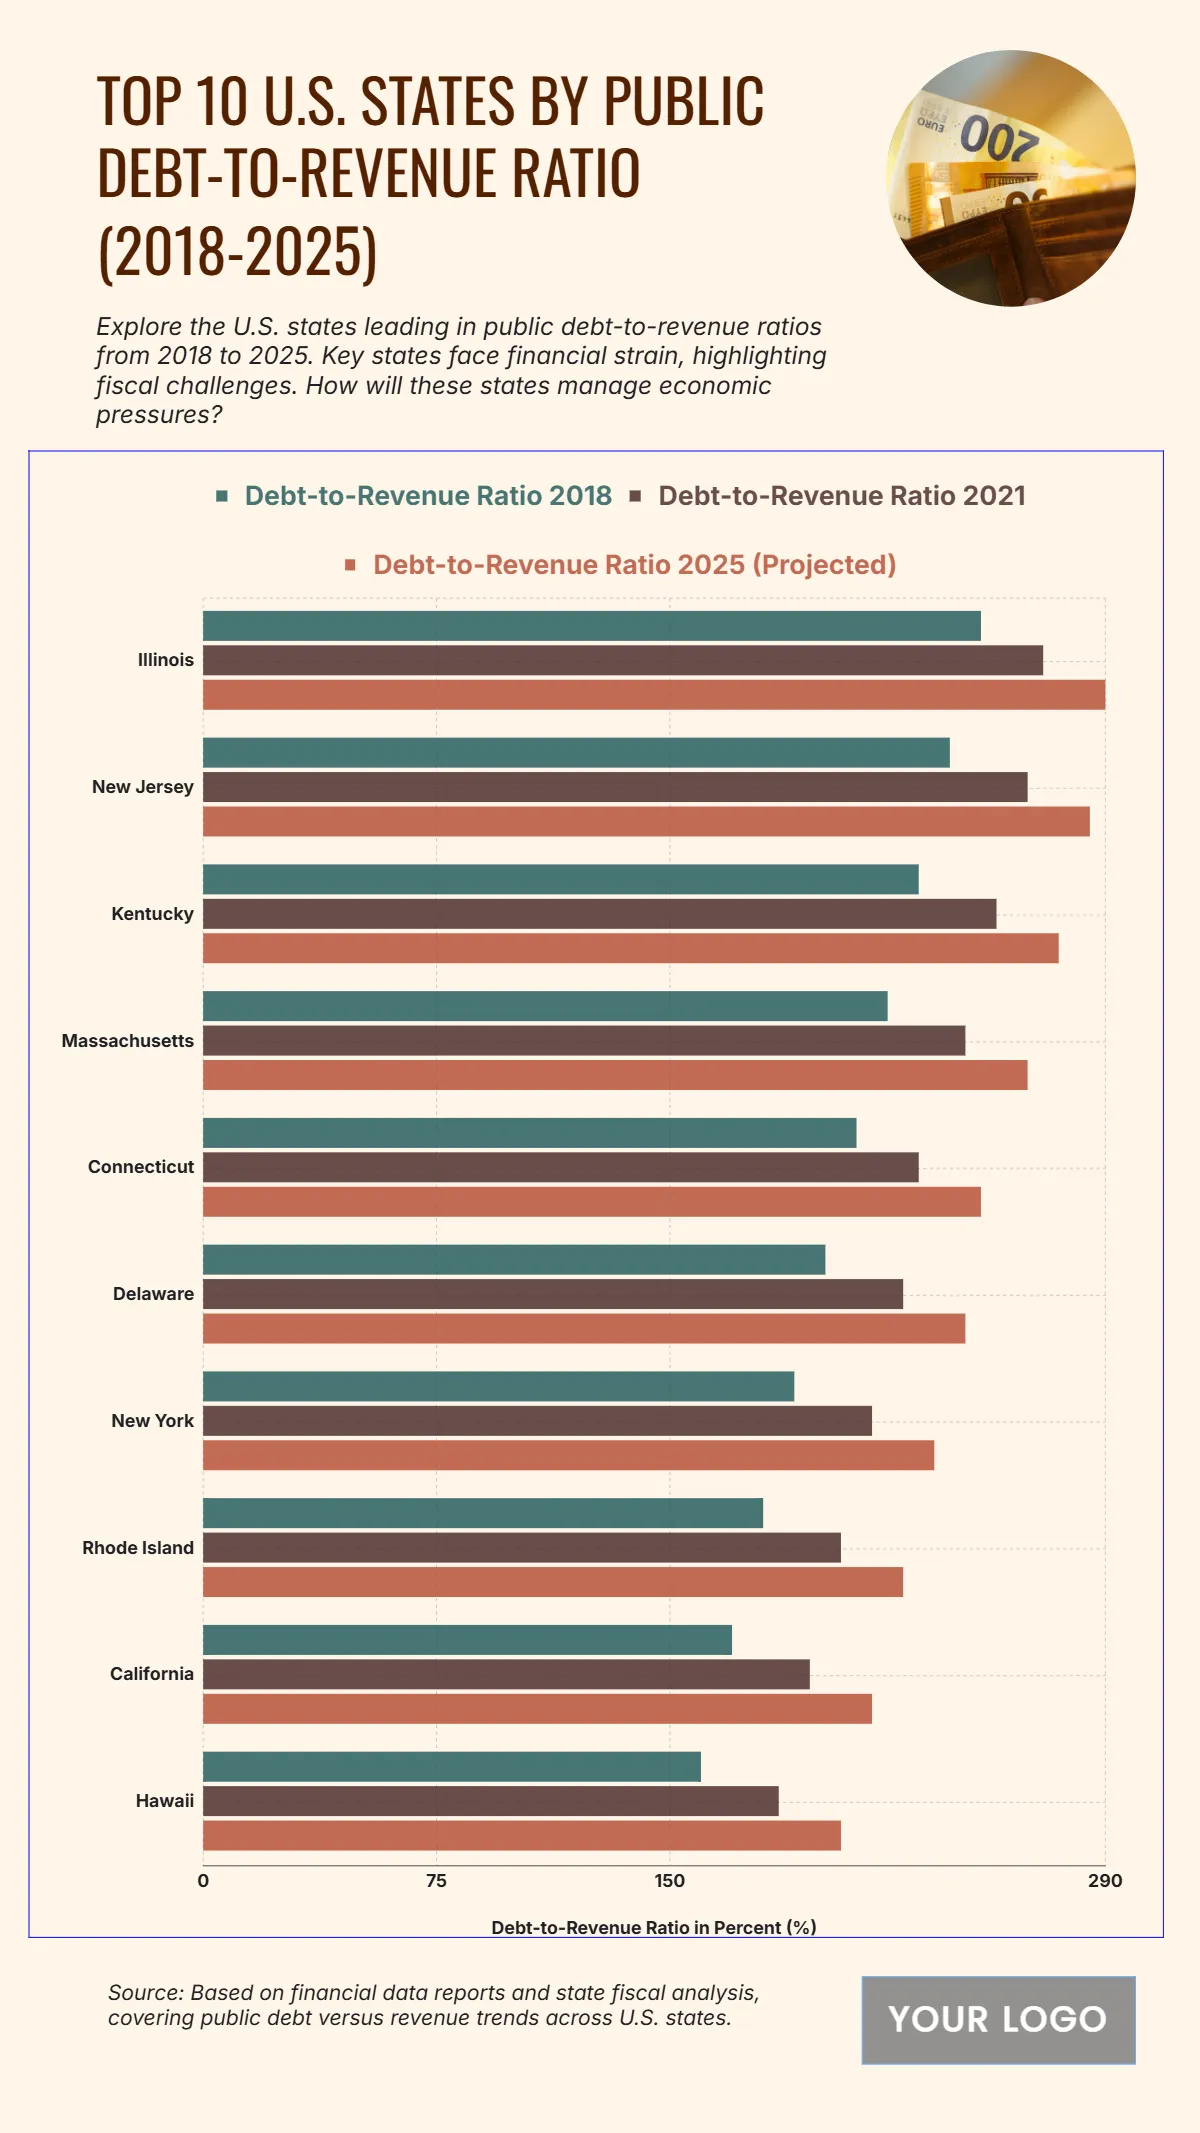
The chart highlights the states with the highest public debt-to-revenue ratios from 2018 to 2025, showing a clear upward trend that reflects growing fiscal pressure. Illinois tops the list, with its ratio increasing from 250% in 2018 to 270% in 2021 and projected to reach 290% by 2025, indicating a significant fiscal burden. New Jersey follows closely, rising from 240% to 285% over the same period. Kentucky shows a similar pattern, climbing from 230% in 2018 to 275% in 2025. Massachusetts moves from 220% to 265%, and Connecticut grows from 210% to 250%. Delaware, New York, Rhode Island, California, and Hawaii also experience steady increases, with Hawaii rising from 160% to 205%. These numbers reveal intensifying debt pressures across multiple states, which may affect fiscal strategies and economic stability over the next few years.
| Labels | Debt-to-Revenue Ratio 2018 | Debt-to-Revenue Ratio 2021 | Debt-to-Revenue Ratio 2025 (Projected) |
|---|---|---|---|
| Illinois | 250 | 270 | 290 |
| New Jersey | 240 | 265 | 285 |
| Kentucky | 230 | 255 | 275 |
| Massachusetts | 220 | 245 | 265 |
| Connecticut | 210 | 230 | 250 |
| Delaware | 200 | 225 | 245 |
| New York | 190 | 215 | 235 |
| Rhode Island | 180 | 205 | 225 |
| California | 170 | 195 | 215 |
| Hawaii | 160 | 185 | 205 |


